Crypto Academy / Season 3 / Week 7 - Homework Post for Professor @kouba01
My Regards to Prof. @kouba01,
I am your new student in the advanced class of season 3 Week 7 this.
I am very happy with this lecture, it challenged me to complete and understand how to "Trading Crypto With Average Directional Index (ADX) Indicator". I am a novice trader and hopefully in my description of Prof. I can become a trader who can understand the market cycle later. Please correct Prof. If there is an error in my description later.
- Discuss your understanding of the ADX indicator and how it is calculated? Give an example of a calculation. (Screenshot required)
ADX indicator
The ADX indicator is a feature that makes it easier for market users to analyze the current cycle in the market, be it assets, currencies, gold or silver, and many more and is one of the indicators used by traders around the world in analyzing trends. what is happening, either going down or going up. This ADX indicator has been used since the first time in 1978, and in that year I was not born.
ADX stands for Average Directional Index which is one of the indicator features. ADX is more used to see if a trend is strong or weak. This ADX has a scale from 0 to 100, from this scale it will show whether the trend is strong or not.
The way to analyze trends on ADX is as follows;
- If the value is 0-25: at this value the trend is very weak and is considered no trend.
- If the value is 25-50: at this value it is analyzed that there is a market trend.
- If the value is 50-75 : this value indicates that the market trend is very strong.
- If the value is 75-100: this value shows a very strong market trend.
All of these values have a trend analysis that is from a weak trend to very strong, based on each value described above. The value of 25 is indicated by a horizontal line indicating the boundary between the non-trend and the trend.
To make it easier to read the indicator, it would be nice to add a DMI (Directional Movement Indicator) indicator, which is an indicator consisting of +DI or Positive DMI and -DI or negative DMI. For TradingView customers who take the free path, it is still possible to use 3 indicators at once, and for beginners like me, this is good enough for analyzing market trends.
The addition of the DMI indicator, namely an indicator consisting of +DI or Positive DMI and -DI or negative DMI to read market trends is okay if it is used together with the ADX indicator. This will add more insight and trend analysis and give us a lot of advantages without having to spend a long time, the term shortens the analysis and makes the analysis more accurate even though it is not sure automatically.
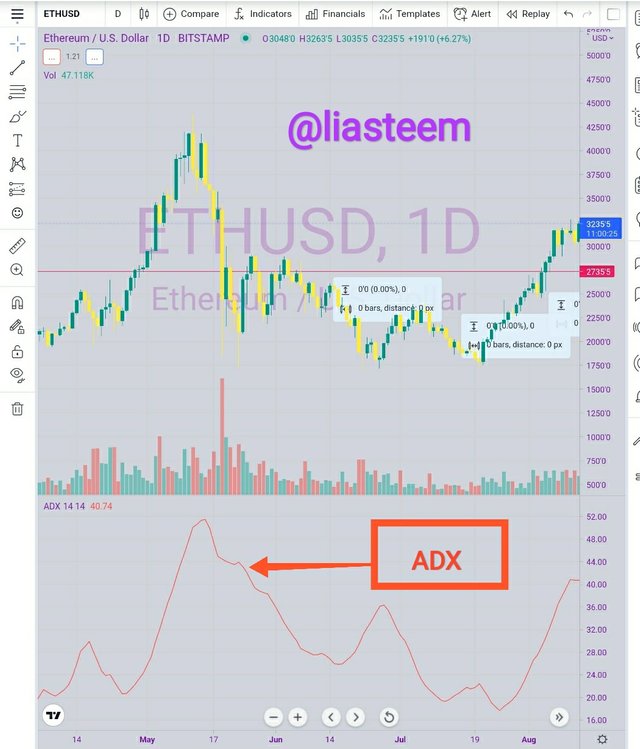
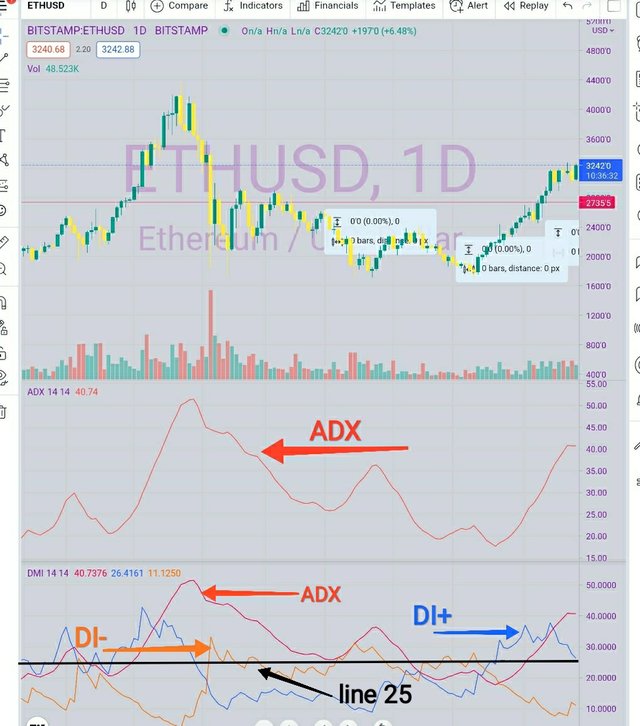
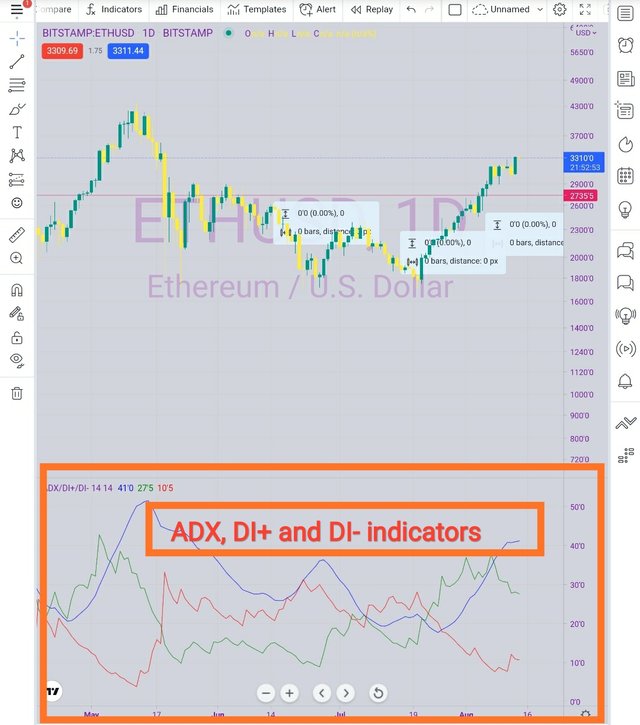
Look at the chart screenshot I took above, ADX only works to show the market direction if there is a trend, this is not complete, so it is necessary to add the DMI indicator that I described above. ADX is indicated by a red line, DI+ is indicated by a blue color, which indicates the strength of the uptrend and DI- is indicated by an orange color, which indicates the strength of the downtrend.
Like the information we got from the screenshot of my ADX indicator above, ADX doesn't show the market direction at all, but only the market trend. This is not complete because we want to analyze the market trend where when the market trend is up or where the market trend is decreasing. Adding the DMI indicator makes all the information we want about market trends clear.
I took the ethereum/U.S. chart. Dollars, look at the chart. I have made my chart easy to understand how to analyze the market trend by using the ADX and DMI indicators to work to analyze the market trend when it is up or down.
As explained by Prof. How the vertical line is formed to see where DI+ and DI- always cross so that if the market trending phase is up DI+ is above DI- and vice versa, the market trending phase is down when DI- is above DI+. And ADX will increase every time the gap increases.
Passing DI+ and DI- is not a buy or sell signal, these two indicator lines are only to give us information about the strength of the market trend. It is true as usual, if the line goes up it means the strength of the market trend is up, and if the line goes down, it means the market trend is down. Why is it not recommended to trade using the DMI indicator? Because the two lines are often crossed, they often give false information about all market cycles that are happening.
Do not trade using this indicator, this is because the main function of the ADX and DMI indicators is to measure the strength of the current market trend, while for trading, we should use other indicators.
how it is calculated?
DMI Wilder, developed by J. Welles Wilder which analyzes trends both up and down market trends. He analyzed that if the Bullish and Bearish phases are characterized by two consecutive sessions, both up and down. And by doing so, it is possible to measure the range of price variations between the previous and current dates, so with this measurement it is possible to obtain a measure of both buying and selling power.
Here's the formula for calculating DMI. I got these formulas from the lectures of Prof. @kouba01
- First, determine DMI+ and DMI- at time
DMI + = max (0; today's high - highest standby)
DMI- = max (0; low standby - low today)
If during the last 14 periods the price only went up, DMI+ would equal 100, and DMI- would equal 0.
- Then calculate True Range (TR)
TR = MAX (|PH - PB|; |PH - C|; |PB - C|)
C = Price of the day
PB = Lowest price of the day.
PH = Highest price of the day.
DI + = DMI + divided by the value of TR
DI- = DMI- divided by the value of TR
DX = 100 * ((DI+) - (DI-)) / ((DI+) + (DI-))
ADX = Sum of n [((DI+) - (DI-)) / ((DI+) + (DI-))] / n
Current High: 22
Previous High: 20
Current Low: 18
Previous Low: 21
Previous Closing: 23
Number of periods: 14
DMI+: = 22 - 20= 2
DMI-: = 21 - 18 = 3
True Range
TR = ( 22 - 20) = 2
TR = (25 - 21) = 4
TR = (18 - 21) = -3
TR = 5
DI+ = 5 / 4 = 1,25
DI- = 3 / 4 = - 0,75
ADX = 14 x [{(1,25-(-0,75)} / {1,25+(-0,75)}] / 14
ADX = 14 x {(2) / (0,5)} / 14
ADX = 4
And I get ADX result is 4
2.How to add ADX, DI+ and DI- indicators to the chart, what are its best settings? And why? (Screenshot required)
- To add ADX, DI+ and DI- indicators to the chart, we have to open the website TradingView then on the top left side you can click the menu and an option will appear like screenshots below,
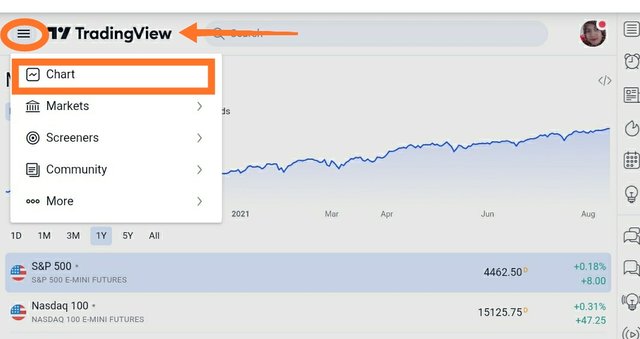
- Then you can press the chart menu, and the chart will immediately be displayed, then click the fx symbol at the top of the chart as shown in the screenshot below.
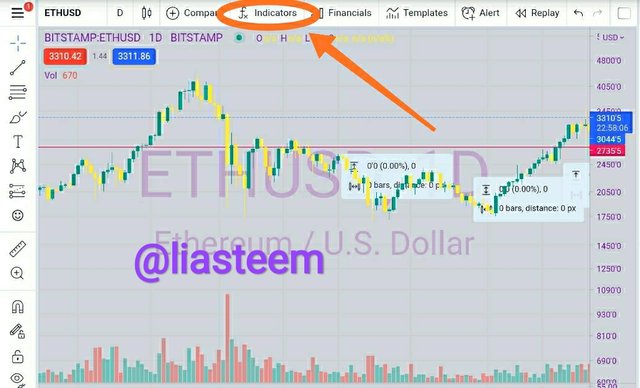
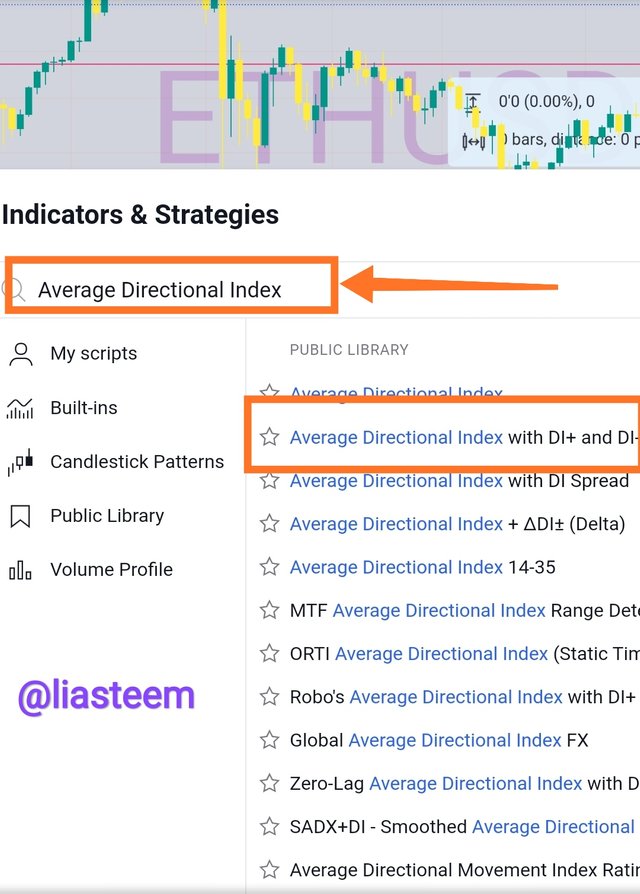
- After the chart is displayed, click the fx symbol which is the icon of the indicator, then several options will appear, to add ADX, DI+ and DI- indicators, just simply type Average Directional Index with DI + and DI-, see screenshot below this!
- After we click the option we want, the Chart will immediately display the indicators used
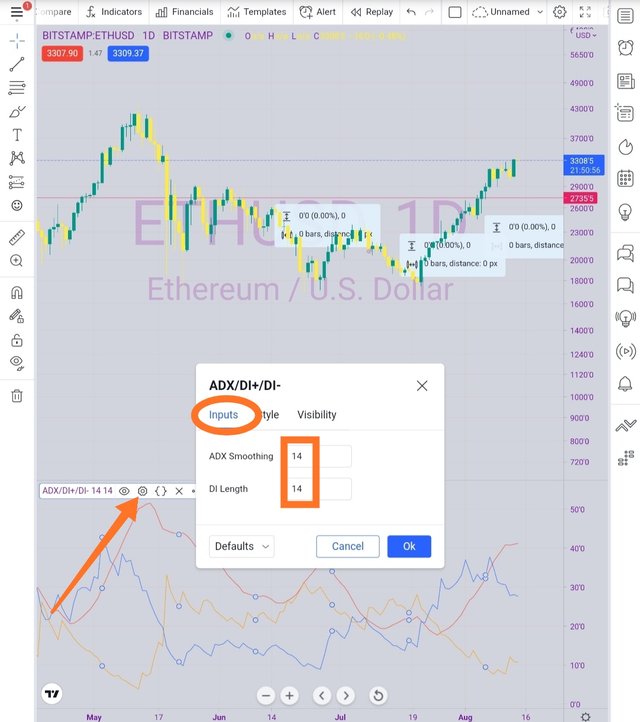
- To configure it:
1-To set the indicators (inputs, style, and visibility), just click on the image (settings) then the page will appear, we can change according to our needs.
2-To change the line on the indicator, select "Input" and change the line color of the indicator as desired.
Best Settings For The ADX Indicator and Why?
ADX 30th
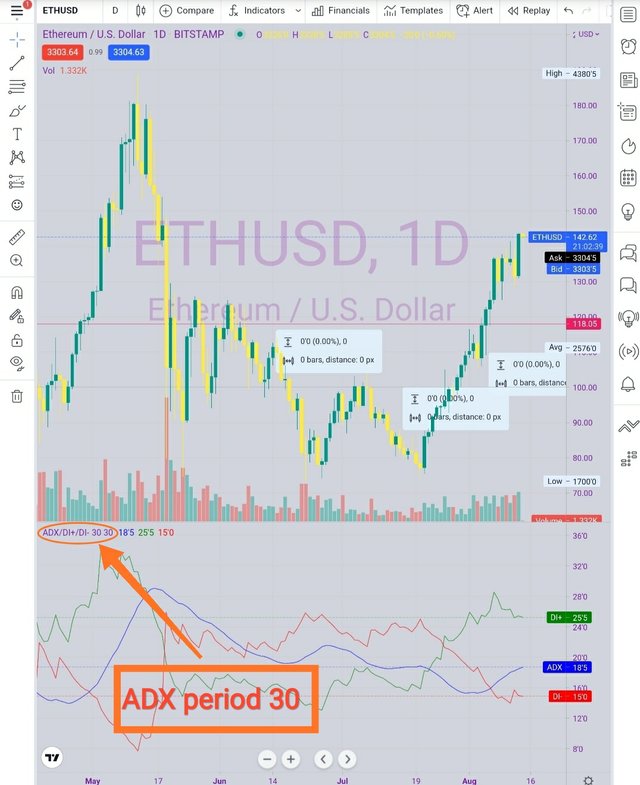
The input we use is the number of the last candle, which of the last number of candles, the ADX indicator is read. Look, I set the default ADX indicator to 30 periods, then it will focus on the last 30 periods. Means here we can change the default settings according to our wishes.
In the screenshot above, I set the ADX indicator setting to 30 as shown in the left corner at the top of the indicator. It takes a little while for the trend line to read, because 3p is a high counter on which we can rely on reading the market trend, both up and down.
ADX 8th
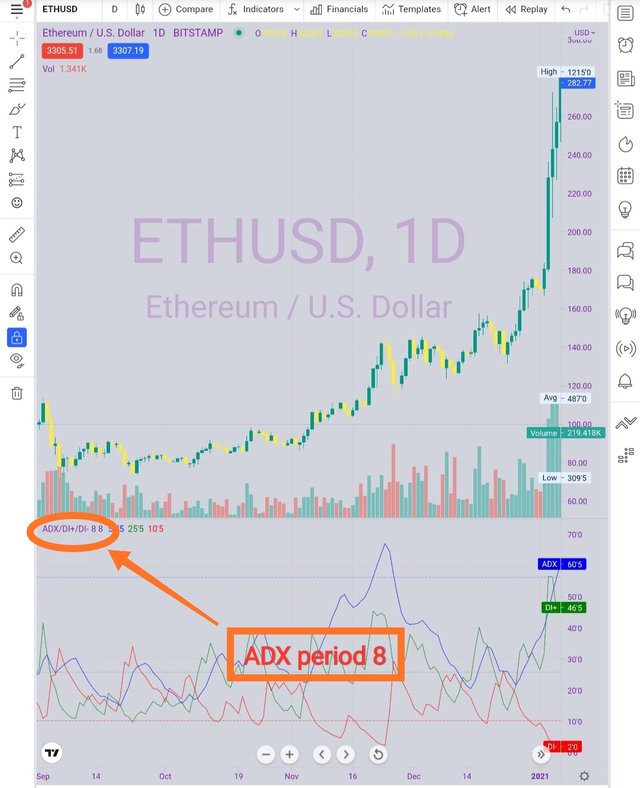
Setting ADX to 8, will be very different from setting ADX to 30, if ADX is set to 30 it will take a long time but reliable, ADX set to 8, readings will be faster but due to this speed, many false trend lines appear, have a look screenshot of ADX which I set to 8 below!
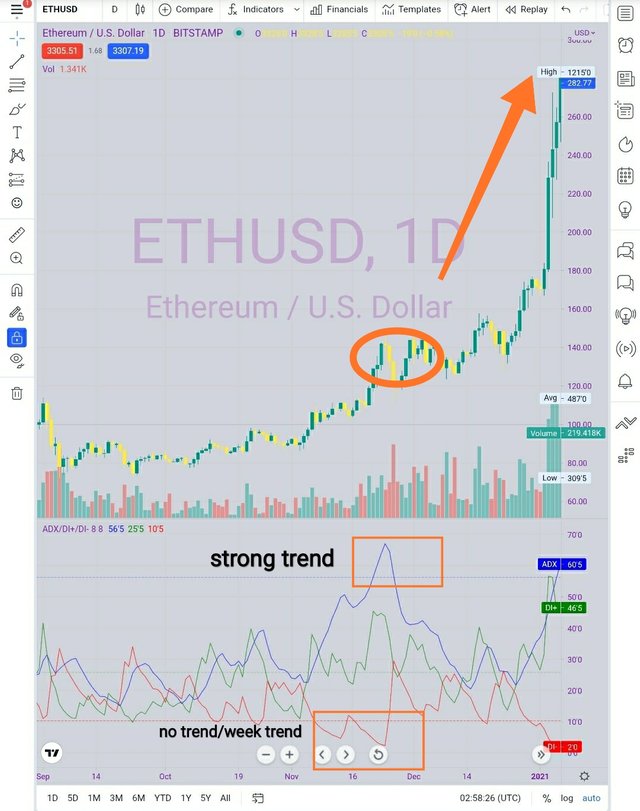
From the screenshot above, we can find out where the false trend is located, which is read by ADX 8, this is why the less, the more fearful the emergence of a false trend line. Take a look at the difference between the two, between ADX which I set the default to 30, and the default to 8.
14th ADX
From the two screenshots above, we see the difference between the two which is very significant to the trend line that occurs. I'll use the default 14, because ADX 14 is commonly used and has a more precise accuracy, although not sure. Scalping trades set the default ADX below 14, meaning that anyone who wants to use ADX can set the default according to my personal needs and desires, and of course according to the trading strategy he is doing.
By using the 14th ADX indicator, I understand more about trend lines, where the trend line is strong, and where the trend line is weak, and minimize false trend lines, so that I can analyze the current trend in the market better and more accurately.
3.Do you need to add DI+ and DI- indicators to be able to trade with ADX? How can we take advantage of this indicator? (Screenshot required)
The ADX indicator is just a single line that provides information about the market trend, however this market trend does not indicate a change in the trend or the expected next market movement. As we know, the ADX indicator shows both rising market trends and falling market trends. If the market trend is up, then the ADX indicator line is pointing upwards, while if the ADX indicator line is declining, the ADX indicator line is pointing downwards, which means the market trend is declining.
Due to the problems I mentioned earlier, traders need to analyze the market trend better and more accurately and indicate about the trend change or the next expected market movement. We cannot read market trends if we know the meaning of each line that an indicator has. Here are the meanings of the ADX trendlines one by one;
- ADX line is a line that shows the strength of the trend
- DI+ is a trend line that shows the strength of buyers
*DI- is a trend line that shows the strength of the Seller
From the two definitions of the DI+ and DI- indicator lines, it is very useful to complement the ADX line, so that it will provide a better reading of the market trend.
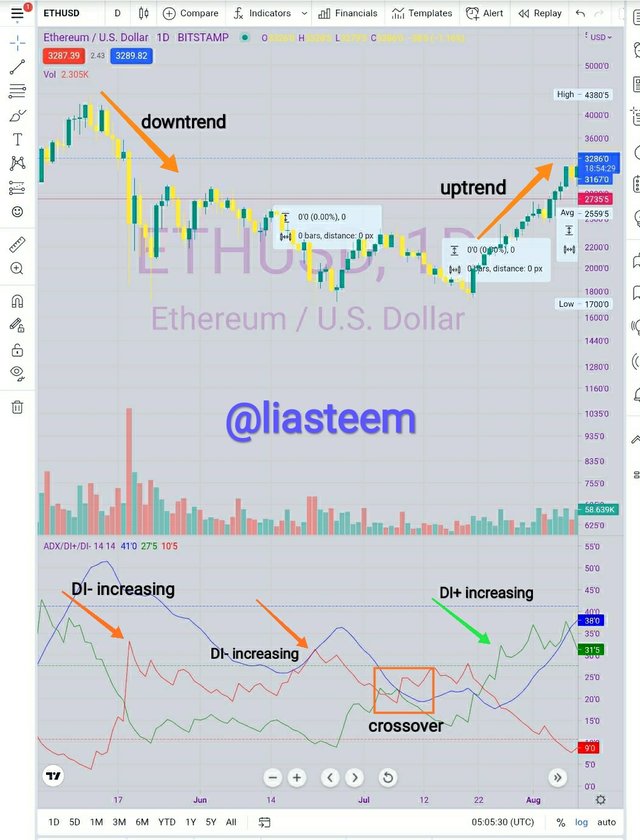
In the screenshot above, we can see where the DI+ is increasing and it can be read that when the DI+ line crosses 25, the UTH trend increases, and vice versa, when the DI- line crosses 25, the UTH trend decreases and can be seen in the screenshot above. . While the crossover is where the trend is almost non-existent, and we can see these three indicator lines are very close together. And the trend repeats itself again with increasing DI+ where the uptrend begins, and that's how the cycle of market trends will always move up and down.
4.What are the different trends detected using the ADX? And how do you filter out the false signals? (Screenshots required)
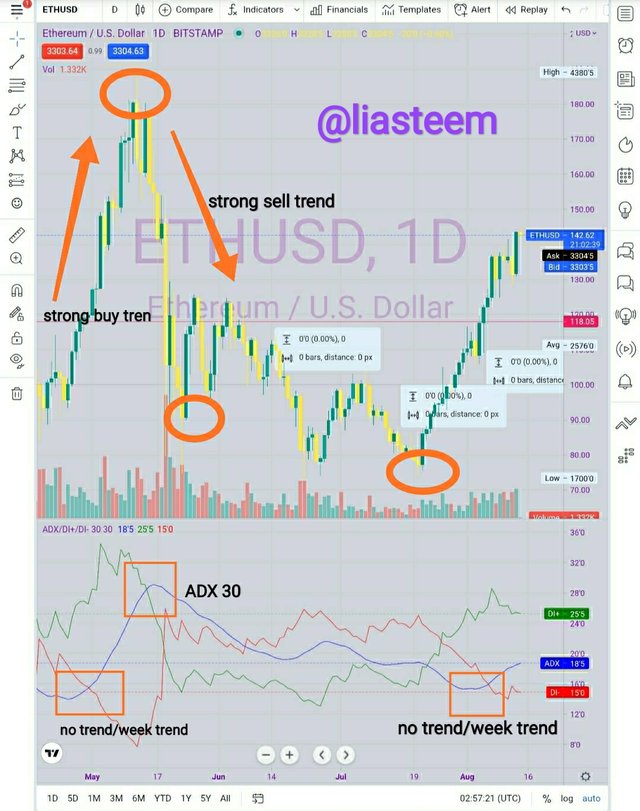
There are some clear trend differences when the chart uses the ADX indicator, while the differences are as follows;
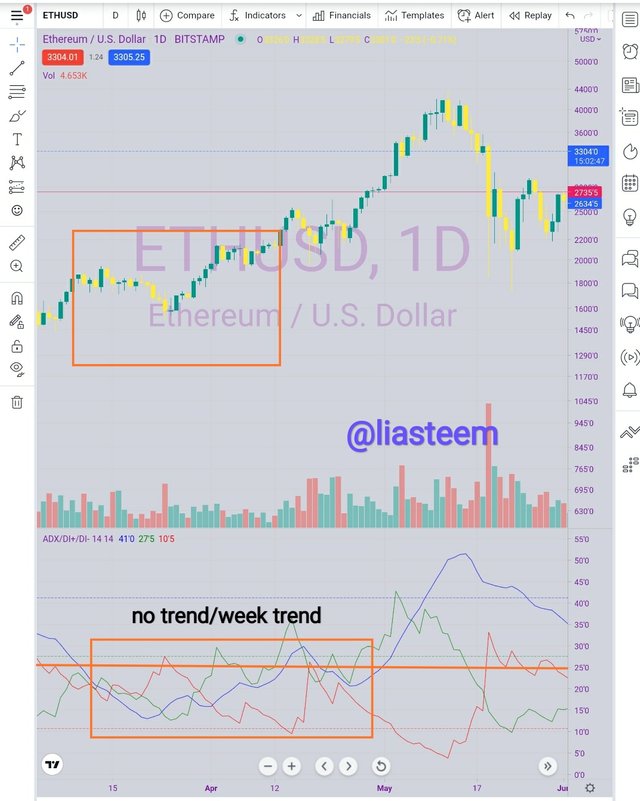
- No trend or Weak trend
As we know that the indicator moves from 0-100, but in this case, the indicator line moves below the number 20-25 which indicates that the trend below this line does not exist or the trend is weakening.
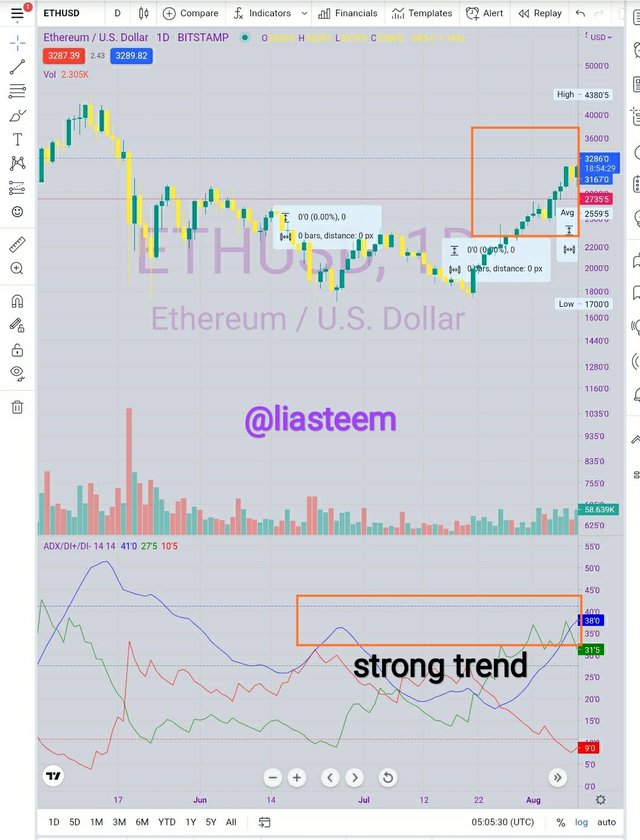
- Strong Trend
This trend is read when the ADX indicator line goes up, DI+ crosses the 25 line and DI- also rises above 25 until it reaches below 50.
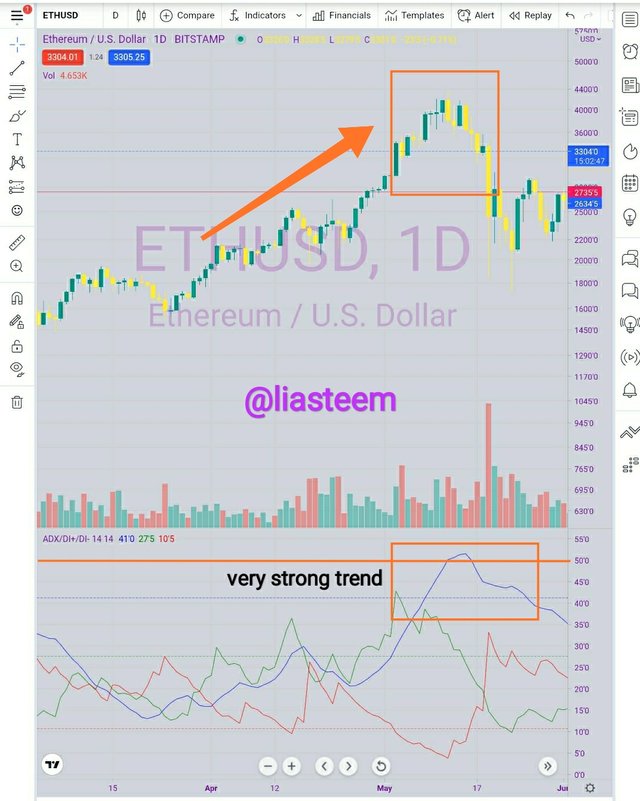
- Trend is very strong
This trend is read when the indicator line goes beyond the 50 figure line and below the 75 figure. This trend does not appear often, but we can still find it.
- Extremely strong trend
The ADX indicator moves from zero to 100 so if the indicator line crosses the 75 line to reach 100, this is an extremely strong trend. It is very hard to find and this is a rare trend, if any, it will be recorded in the crypto social media e-books.
how do you filter out the false signals? (Screenshot required)
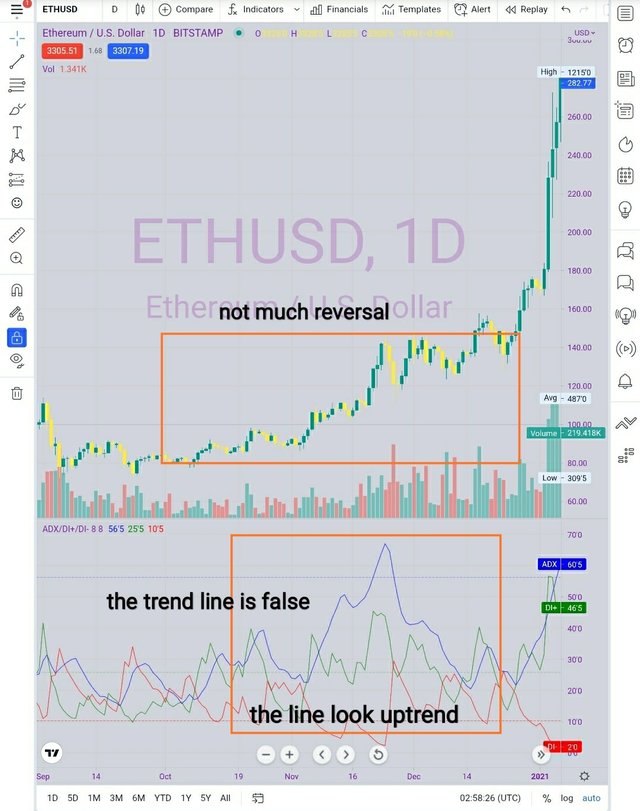
Look at the screenshot above, there we can see that the ADX trend line is above 60, and this means that the market trend is currently up, but when we look at the actual chart, we can see that not much cyclical movement of the market is happening, even the market is in a bearish period. If we only use the ADX indicator, then obviously we may be deceived by the actual market trend activity and make our market trend analysis wrong and when traders use this analysis to trade, they will lose a lot.
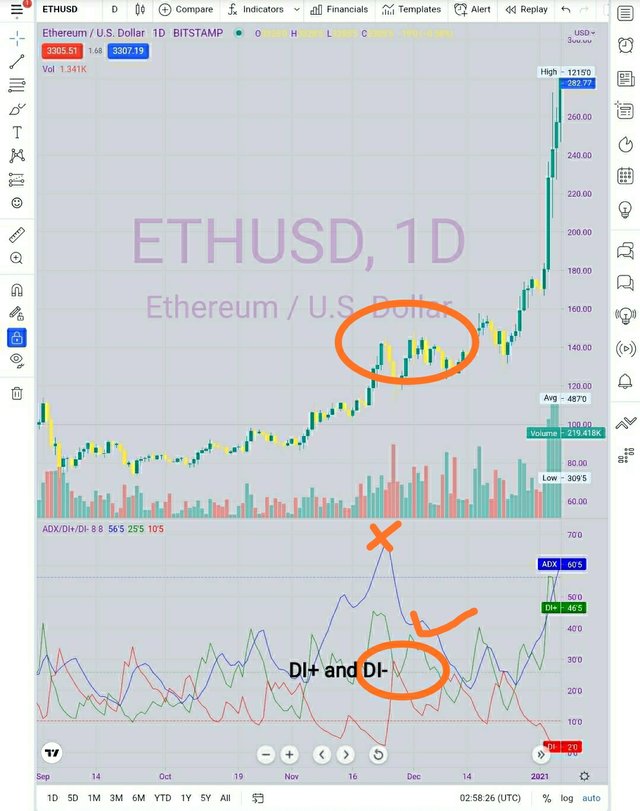
Therefore, with the additional indicators DI+ and DI-, the trend line is reversing from the ADX trend line, we can conclude using these two indicators that here there has been a false trend reversal and we can prevent trading which reverses the market situation. DI+ is moving downwards below 25, it indicates that the asset price is going down. On the other hand, DI- moves to cross the 25 line upwards indicating the asset price is going down. So, it would be nice to pair the ADX indicator along with other indicators to ensure a true analysis of market trends, even if none of them are 100% accurate.
5.Explain what a breakout is. And How do you use the ADX filter to determine a valid breakout? (Screenshots required)
A breakout is an event where the price breaks out of a market price that is being traded for some time. Breakout can also be called a situation where a price level is broken. Many consider that this breakout event is a big advantage and occurs at an unexpected time considering that this breakout occurred before the market price rose for some time.
Usually traders assume that when the price goes up they sell and when the price goes down they buy. Well, if you trade a breakout, you should buy above the resistance level and sell below the support level.
If the ADX indicator shows a line below the 25 mark, for some time, this indicates that the volatility of the market trend is low and we can still monitor the market trend situation, whereas if the ascending trend line crosses the 25 mark it often indicates a breakout sign and a new trend begins after the breakout event.
How do you use the ADX filter to determine a valid breakout? (Screenshot required)
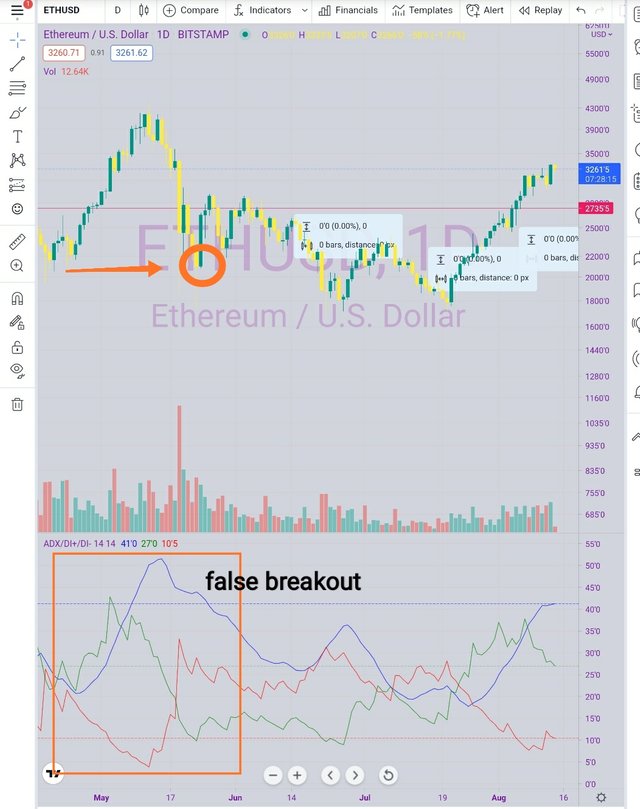
Look at the screenshot above, where we can clearly see how the market trend is up and then down immediately or suddenly the market trend is down. Look at the screenshot above for the second time, maybe novice traders think this is a valid breakout so they are very sure to go short, but what happens? The trend reverses which indicates the next candle to be bearish and a false breakout.
As I explained above, the benefits of using additional indicators with ADX will make our market trend analysis more accurate and avoid things like this. DI+ and DI-work with the trend line function respectively so that a false signal breakout can be filtered out by the ADX indicator with DI+ and DI-.
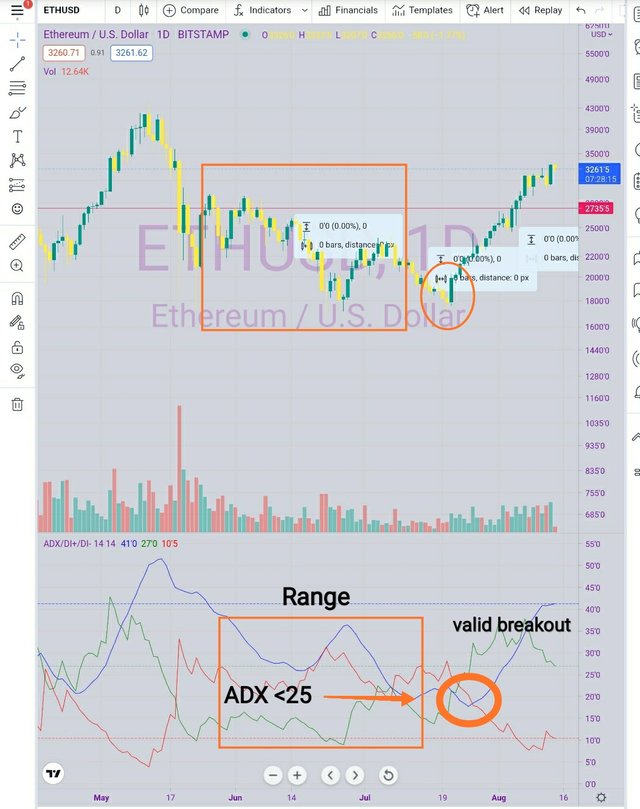
Now take a look at the second screenshot I took below. We can see that both ADX and DI+ are moving up past the 25 mark which indicates that the market trend is up, we can analyze the market trend that it is a valid breakout.
6.What is the difference between using the ADX indicator for scalping and for swing trading? What do you prefer between them? And why?
Using the ADX indicator for scalping
As we know that the ADX indicator is a single trend line where trend information is incompletely packaged, but if it is added with other indicators it will provide more benefits and be more accurate in analyzing trends. Using add Indicators for scalping is a new thing in trading. Traders who use the scalping method can use the ADX indicator by determining the trend that exists at the time they trade and identifying support and resistance levels. Traders usually use shorter time frames to enter trending markets and they will exit there as quickly as they entered. And this scalping method can use
Therefore, the scalping method that uses the ADX indicator will be very helpful if it is accompanied by other indicators such as DI+ and DI-. It is also advantageous if the scalping method takes a short time, so that when DI- crosses 25, they can immediately exit, as well as if DI+ crosses 25, this will result in an uptrend which will be very profitable.
Because the scalping method uses short, this will be prone to false signals, it is hoped that traders are observant in reading market movements, because false signals can often appear, and because using the ADX and DI- and DI+ indicators, this will be very useful.
Using the ADX indicator for swing trading
We know that the use of the ADX indicator in the trading process is very important and useful. Swing trading is a trading strategy that places Buy or Sell executions at price reversal points for a longer period of time compared to scalping. so the profits will be very large when the price suddenly goes in a certain direction.
The ADX indicator is very important when you want to analyze the current market trend so that traders don't misunderstand when trading in the market cycle. Using the ADX indicator in swing trading is very useful, especially with the addition of DI+ and DI- which will definitely make trading easier and more accurate because it uses a longer timeframe than scalping.
7.Conclusion:
From my description above, I can draw several conclusions that;
- ADX is an indicator with a single line that serves to analyze the market trend, whether it is an up or down trend.
- ADX will be very useful when we add it with other indicators such as DI+ and DI-, and various other indicators that make market trend analysis more precise and accurate.
- Changes in market trends can occur at unexpected times, therefore, the use of the ADX DI+ and DI- indicators will reduce our misunderstanding of the current market trend cycle.
- By using the correct ADX indicator formula, we will be able to find out more accurate and valid results.
- Using the ADX indicator with a default of 14 will have a more accurate trend reading and the default of the ADX indicator of 14 is the default that is often used by traders.
Many thanks to Prof. @kouba01 who has given a very useful lecture for me as a beginner. I can find out more about the indicators used in analyzing market trends. If there is an error in my writing and explanation above, please be willing, Prof. Check it out.
I am very happy to follow the lectures of Prof.
Many thanks to Prof. @kouba01
Thanks also to all crypto students
Thanks also to all Steemians
From your little friend
❤️
References
- All photos I take from my personal smartphone camera screenshots
- https://www.hsb.co.id/learn/forex/average-directional-index.html#:~:text=Average%20Directional%20Index%20atau%20ADX,maka%20trend%20tersebut%20sangat%20kuat.
- https://www.google.com/amp/s/www.seputarforex.com/amp/artikel/penjelasan-tentang-strategi-breakout-121009-31
- https://www.google.com/amp/s/www.seputarforex.com/amp/artikel/metodologi-swing-trading-99962-31
- https://www.google.com/search?q=apa+itu+breakout+dalam+trend+pasar%3F&client=ms-android-xiaomi&sxsrf=ALeKk00b_8oT2tJlPpm3YEBoJLlp_vXBuA%3A1628937091685&ei=g5sXYbSJKdvWz7sP5KWt6AY&oq=a&gs_lcp=ChNtb2JpbGUtZ3dzLXdpei1zZXJwEAEYADIECCMQJzIECCMQJzIECCMQJzIECC4QQzIFCAAQkQIyBQgAEJECMgQIABBDMgsILhCABBCxAxCDAToECAAQRzoHCCMQ6gIQJ1DSqgFY0qoBYN7IAWgCcAF4AIABjAKIAYwCkgEDMi0xmAEAoAEBsAEPyAEIwAEB&sclient=mobile-gws-wiz-serp
- https://www.tradingview.com/chart/6PS18azf/
Hello @liasteem,
Thank you for participating in the 7th Week Crypto Course in its third season and for your efforts to complete the suggested tasks, you deserve a 9/10 rating, according to the following scale:
My review :
Very excellent work which covered the subject in all its aspects in a superb manner and with a solid methodology. Most of the answers were precise and direct.
The Average Directional Index (ADX) is used to measure the strength or weakness of a trend only, not the actual trend. A common misconception is that a falling ADX line means that the trend is reversing. A falling ADX line only means that the trend strength is weakening, but that usually does not mean that the trend is reversing.
In the last question, your answer was general, you did not go into details and did not provide some illustrative examples.
Thanks again for your effort, and we look forward to reading your next work.
Sincerely,@kouba01
Thanks you very much Prof. @kouba01
I do not so understand here prof. when I took the value of these formulas .. I want to learn more about these formulas.
Once again thank you very much Prof.
I hope Prof. always in healthy and have a good day.🙏