Crypto Academy Season 5 [ Advanced course ] week 1: Crypto Trading With Average True Range (ATR) Indicator
The ability to predict the implications of the transactions taking place in the observed crypto markets in a given time frame, is naturally an essential part of the life of any online trader.
This skill must be combined with that relating to the efficient management of cryptocurrencies, it is these two elements that allow us to make us select the right type of option to apply in a given context.
In order to be highly efficient in the trading process for traders and to be sure of winning, they must use supporting indicators. Among the countless indicators of the stock market, there is an interesting indicator that is always interested in the ATR (Average True Range) indicator. Although named as an indicator, ATR is used to indicate market volatility in price movement instead of the function of predicting the upward / downward trend of that price.
Therefore, the ATR indicator is often used as a tool to support setting take profit or stop loss levels rather than setting up a BUY / SELL order. So to better understand what is the ATR or Average True Range indicator? How to use ATR only effectively, please refer to the article below!
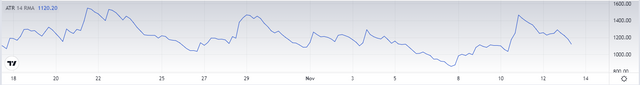
The ATR indicator, as we mentioned, is used to interpret the volatility of a chart.
By “volatility” we mean the behavior of the price over time: when it makes significant movements and these are very frequent, we say that the asset is in a very volatile phase. On the contrary, the less volatile market phases see weak and less frenetic price movements.
The ATR was originally created for use in commodity trading. Commodities are a very special market, where it is important to keep an eye on volatility in order to enter and exit the market at the right time.
Over time, this indicator has started to be appreciated more and more even by those who trade Forex and stocks.
If you are a novice trader, you may find that only indicators that help you identify a trend reversal or those that allow you to understand whether the market is overbought or oversold are useful.
Over time, however, traders realize that the markets don't always behave the same way; Technical analysis works great when volatility is low, but when volatility is high, indicators tend to generate a lot of false signals.
If you want to be a complete trader, you need to start realizing the importance of volatility and understanding its effects on chart movements. ATR is definitely a great place to start.
To make the right trading decisions, a trader must understand how their preferred indicators are constructed. We are going to show you how to calculate the ATR in the crypto market without going deeper into the mathematical formulas.
ATR measures the average movement of market prices. ATR is usually done through one of 3 methods of determining true range (TR) values, depending on how the candlesticks are formed.
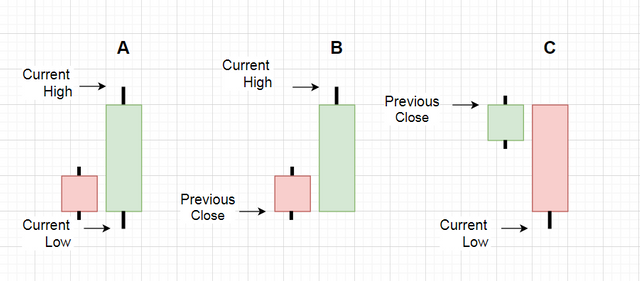
- Method 1: Current high is lower than current low, used when the range of the current candlestick is wider than the previous price.
- Method 2: The current high is lower than the previous close (absolute value). ATR is used when the current bar closes higher than the previous bar.
- Method 3: Current low is lower than the previous close (absolute value), used when the current body closes below the previous price.
Therefore, we can assume that the larger the range of candlesticks, the higher the value of the ATR indicator.
By default, the period on which the Average True Range (ATR) indicator is based is 14 periods and can be calculated daily, weekly or monthly.
To generate the first, the first true range value is calculated as the high value minus the low value. The 14-day ATR is the average of the actual daily values over the last 14 days. The formula for calculating ATR looks like this:
Current ATR=((Prior ATR*13)+Current TR)/14
Multiply the previous 14 day ATR by 13, then Add the most recent day's TR value and finally, Divide the total by 14.
The True Range TR is, for the relevant period (week, day, hour, etc.), the largest of the three above.
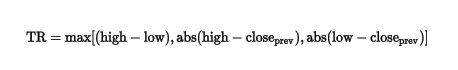
- max: the difference between the high of the day and the low of the day
- abs 1: the absolute value of the difference between the closing price of the day before and the high of the day
- abs 2: the absolute value of the difference between the closing price of the day before and the low of the day
The ATR indicator can be set to different time periods which affect the sensitivity of the indicator.
The standard ATR setting is 14, which means that the indicator measures price volatility based on the last 14 periods. As mentioned above, this is usually 14 days.
Using a lower setting gives the ATR indicator a smaller number of samples to work with, which makes the indicator more sensitive to recent price movements and gives a faster reading.
Using the higher setting has the opposite effect, it gives a much smoother range that tends to remain relatively unchanged over long periods of time.
The images below show how these two extremes appear differently on the charts:
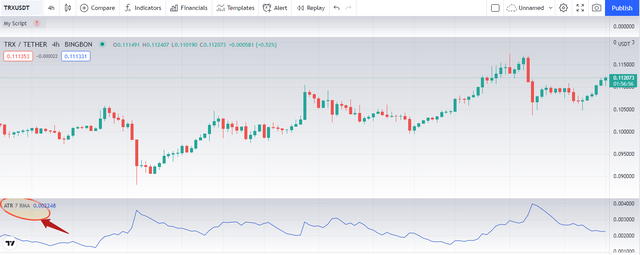
In the example above, the ATR is set to 7 (the top left corner of the indicator window), which is exactly half of the standard setting of 14. This results in a very choppy ATR line.
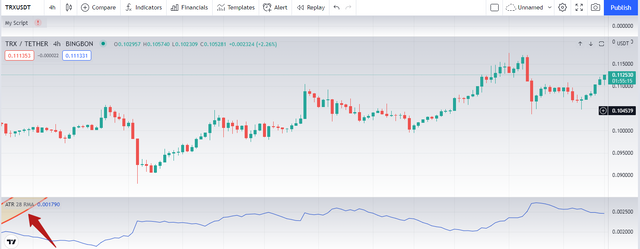
In the image above, the ATR is set to 28, which results in a much smoother ATR streak.
When changing the ATR settings, it is important to check whether the changes actually improve your trading results.
To see which settings suit your personal trading strategy and style, place a series of trades using each of the settings you want to test, record the results in your trading history and then compare to see which one is more profitable for you.
The ATR indicator is extremely easy to read: since it is an indicator that concerns the very notion of volatility, it constantly evolves and occurs in cycles. The movement tends to constantly return to its average.
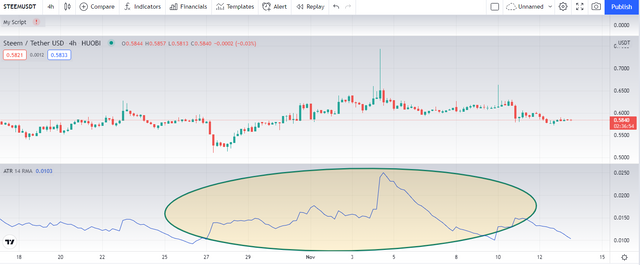
As you can see on the screen, the behavior of the ATR indicator tends to repeat itself, and is particularly useful precisely because at low values the height of the candles is particularly low. At a high value, however, the candles increase in height.
The ATR indicator is especially useful if used simultaneously with other indicators, including the Parabolic SAR, also created by Wilder.
Parabolic SAR, in fact, is able to confirm whether or not high volatility values correspond to a stock's momentum strength.
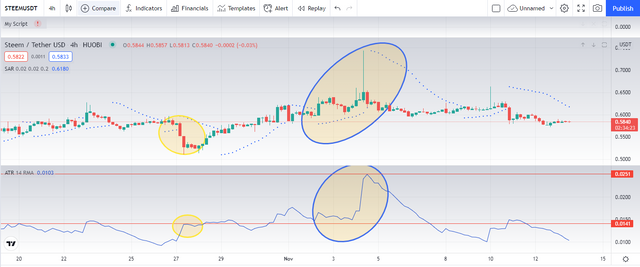
In the picture, you can clearly see how the bearish movement (yellow circle), although characterized by a weak ATR value of around 14.1 pips, is less strong than the next bullish moment (blue circle), characterized by a higher volatility, with the ATR reaching 25.1 pips, but by a higher impulse force.
The combined use of the two tools developed by Wilder allows to achieve decidedly surprising results, allowing you to develop more precise estimates on the objectives of the analyzed trend, quantifying with more precision the prices that can be achieved in the next period.
We generally recommend that you use the ATR indicator in conjunction with three other main tools. Of course, you can also use others, to give more precision to your forecasts.
Usually the ones we always use in combination with ATR are:
- CCI indicator , to confirm the data of the previous indicators.
- Parabolic SAR , as we have already told you, for a more precise assessment of the strength of the trend.
- Zig Zag which, based on Elliott wave theory, allows you to identify in which phase of the development model of the stock market trend you are.

This is a direct comparison between the evolution of the stock chart and that of the ATR indicator: an increase in volatility corresponds, as we have told you, to the candles with the largest stem. In addition, the ATR indicator tends to change as soon as the minimum value is reached.
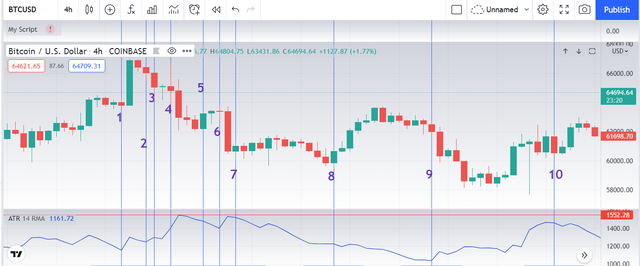
Analyzing the BTC / USD pair with a period of 41 hours, for example, it is evident that after a minimal spike in volatility (1), the ATR indicator immediately experienced a rapid spike in its values (2, 3, 4).
It is a phase of high volatility which inaugurated a downward trend and characterized it throughout its duration.
As soon as the trend ended (5, 6), volatility began to fall back to the minimum (7, 8), to then see a new trend reversal, with a new downtrend which again ended with a inversion of the ATR indicator (9, 10).
There is not always such a match, but ATR changes often correspond to price impulse reversals.
This application of the ATR indicator is based on the rule that strong trends necessarily correspond to high volatility values.
This allows in particular to understand, by a direct comparison between the chart of the action and that of the indicator ATR, what is the dominant force on the price, or what is the trend which gives the most impetus to the action.
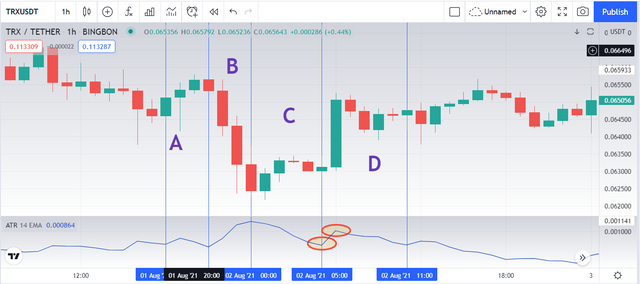
Consider the TRX / USDT pair: as you can clearly see in the picture, in the A sector the price rise is not supported by the ATR indicator, as well as in the C sector. This indicates that the increase observed in these two occasions does not correspond to the dominant force on the price.
In contrast, in Sector B, the ATR indicator rises as much as the price falls, indicating that the prevailing force at the moment is bearish.
However, on the occasion of the two orange circles there is a trend reversal: after recording a variation peak of 11.41 pips, the price has reversed its trend, and the ATR indicator signals a decrease in volatility in correspondence with the drop in D.
It is no coincidence that you look at the following two candles, in addition to indicating a rise in prices, both are characterized by an increase in volatility, a sign that the dominant force is now bullish.
If you are wondering when is the right time to enter the market, trend reversals are the best time par excellence.
The ATR indicator does not exhaust its usefulness only in the analysis phase, but is also particularly important for other trading tools, in particular those for risk management.
These two tools are the only safety belt available to you while you are operating on the financial markets, the ones that allow you to insure your investment against unexpected events or temporary absences.
If the financial markets never sleep, this can't be true for people and being able to control your investment even when you can't stay glued to the screen is of paramount importance.
These two tools are Take Profit and Stop Loss.
Stop Loss: Loss control :
Stop Loss is of fundamental importance: without it you will never be able to sleep peacefully. Have you ever read the stories of users who forgot to put it on the web? Do you know what happened?
They woke up the next morning to find that their account with the broker they were trading with was in the red for tens and tens of thousands of dollars.
This alone is more than enough reason to always think about setting an Automatic Stop Loss before permanently opening a position. This is to determine a minimum price threshold that the stock can reach, after which the investment will close automatically and you will not continue to lose money.
In addition, the ATR indicator provides you with a good method to calculate the Stop Loss on your investment. The formula is:
Entry point +/- 3xATR
Taking the example of the XRP / USDT pair, deciding to open a position with a starting price of $ 1.24 and with an ATR of 0.0179, the Stop Loss will be set at around $ 1.186.
Keep in mind that this is an approximation, it is up to you to decide, depending on your investment and the capital you want to put at risk, which Stop Loss is suitable for your trade.
Take Profit: when to close a position
Complementary to Stop Loss, Take Profit allows you to set the maximum value threshold of your position. It is about identifying the value, at which point your investment will close automatically and you will reap the profits obtained.
The speech is almost the same: not being able to remain glued to the screen of your platform for a whole day, the Take Profit will allow you to make investments even in the long term without them being exposed to the risk of a change. brutal.
If you open a long position without Take Profit, while distracted, for example, you will not be able to close the investment on time and what could be a very good potential profit can turn into a dead end if not, indeed, in a loss!
Pros:
The main advantage of the ATR indicator is that it is very easy to use and it can give you very good entry and exit points if used with other indicators.
In addition, due to its simplicity, it can help you focus more on your technical analysis, as you don't have to worry about where you put your takeprofit.
Another advantage of the indicator is that it does not take up much space on your stock chart, therefore it does not alter the reading of your technical analysis.
So you can use this indicator with all trading strategies and you don't have to worry about your chart being too crowded and confusing.
Cons:
The drawback of the ATR indicator is that despite the relevance of its indications, the strength of the volatility given by the Average True Range does not really give any input signals that can be directly exploited.
Indeed, it is often necessary to supplement the signal given by this type of chart, by using another technical indicator which will allow us to identify an interesting input signal.
ATR is not a directional indicator like MACD or RSI. Rather, it is an indicator of volatility that reflects the degree of interest or disinterest in a move. Strong trends, in both directions, are often accompanied by so many strong pulses that result in high True Range values. This is especially true at the start of a trend. ATR can be used to validate the enthusiasm behind a trend or following a breakout. A bullish reversal with a rise in the ATR would show strong buying pressure and strengthen the reversal. A breakout of support, with the ATR rising, would show strong selling pressure and strengthen the breakout of support.
It is also interesting to use it as an indicator of levels linked to the volatility of the underlying rather than to its graphic configurations. For this reason, it becomes very useful to indicate the level of the stop loss and / or also as a stop trailing.
Finally, the ATR is the starting point for the calculation of another very important indicator which is the Supertrend.

1. Discuss your understanding of the ATR indicator and how it is calculated? Give a clear example of calculation
2. What do you think is the best setting of the ATR indicator period?
3. How to read the ATR indicator? And is it better to read it alone or with other tools? If so, show the importance. (Screenshot required)
4. How to know the price volatility and how one can determine the dominant price force using the ATR indicator? (Screenshot required)
5. How to use the ATR indicator to manage trading risk ?(screenshot required)
6. How does this indicator allow us to highlight the strength of a trend and identify any signs of change in the trend itself? (Screenshot required)
7. List the advantages and disadvantages of this indicator:
8. Conclusion:
Try to read the lesson and the assignments carefully before you start editing.
You must write an essay that contains at least 600 words.
Make sure that you post your homework into the SteemitCryptoAcademy community, and your homework title format like this "[Title]- Crypto Academy /S5W1-Homework Post for kouba01
Please do not add the tag #club5050 if you do not interpolate all the conditions to participate in this initiative.
Use copyright-free images with mention of its source, if possible, produce your own.
Plagiarism is forbidden in Steemit Crypto Academy, and its perpetrators may face serious penalties.
This homework assignment will run until 20th Novembe'2021, Time- 11:59 PM UTC.
Include in your post among the first five hashtags #kouba-s5week1 and #cryptoacademy.
Users who are powering down will not be voted and considered excluded from participation.
Additionally, users with a reputation below 65 and/or haven't at least 900 SP in their wallet won't benefit from voting for their homework.


Cc:-
@steemitblog
@steemcurator01
@steemcurator02
#club5050 😀
I will powerup my all amount by the end of this month. In sha Allah
Nice lecture, Sir professor @kouba01
This is very interesting and useful, as always. But I can't seem to participate in this week's courses. Anyway, thanks for the lecture, Professor.
finallyyy we are back. Thank you for this amazing lecture professor.
Good to see you back again professor. Thanks for all your efforts. We appreciate you.
Link to homework task
https://steemit.com/hive-108451/@drqamu/average-true-range-atr-indicator-crypto-academy-s5w1-homework-post-for-kouba01
Hola estimado profesor @kouba01, me encantan estos temas de los indicadores, estoy un poco confundida con lo del club5050, creo debo ponerme al día con eso primero y no se si pueda participar acá. De todas formas le seguiré leyendo...Un abrazo.