Crypto Academy Season 4 [ Advanced course ] week 4: Crypto Trading With Williams % R Indicator

In this in-depth analysis we will deal with one of the most famous and used indicators in the world of online trading , the Williams Percent Range indicator , also known simply as WPR.
The trading indicator in question has achieved considerable success among various traders as it allows to obtain different trading signals . In fact, it offers different but interesting interpretations of the market, especially if it is combined with other similar tools.
What the course will deepen will concern the Williams% Range, whose first studies appear as early as 1973 and how to apply this indicator to crypto trading.
Because as Larry Williams himself said , creator of the oscillator in question:
Success is the result of endless study and field experience, not a natural instinct.

The Williams% R or William's Percent Range (% R) is a technical indicator of momentum that was invented by Larry Williams in 1973.
Larry Williams is an author and commodities trader who also invented many technical indicators, but the% R is probably his best known technical tool.
It is a simple but effective oscillator which indicates the speed at which the price is moving, and which aims to detect areas of accumulation which may lead to a trend reversal.
The indicator which bears the name of its inventor participates in technical analysis in the sense that it makes it possible to detect trends and anticipate the evolution of the stock markets.
It makes it possible to quantify the bullish and bearish sentiment of the market by measuring the ability of the Bulls and Bears to close stock prices close to the upper and lower limits over the period studied, thus making it possible to identify the areas of trend reversals.
Its chart moves near zero when bulls peak in strength and 100 when bears peak in strength and close prices at the low of the period.
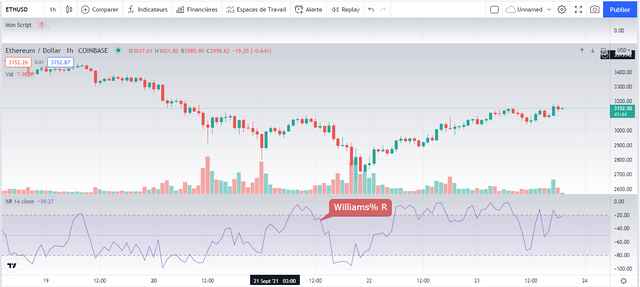
On the chart below we have added the Williams Percent Range. As you can see, the indicator fluctuates as it tracks the fluctuations in the price of Ethereum.
For the mathematical calculation of the indicator, the formula is as follows:
% R = (maximum value of the price of an asset verified in a previous "n" period - value of the price at daily close) / (maximum value of the price of an asset verified in a previous "n" period - the lowest minimum value reached by asset prices over “n” previous periods) * -100.
For example, if in the 21 observation days preceding the investment transaction it was verified that the maximum value of an asset was equal to 100 and the minimum value equal to 78, while the closing value during the observation day was equal to at 80, the operation will be as follows:
% R = (100 - 80) / (100 - 78) * -100
% R = 20/22 * -100 = - 90%
% R = -90% is an oversold signal, so in the short term the trend will change by exiting the oversold threshold and consequently it is time to sell or buy depending on the type of operation you want to trade.

For this I will use the dynamic graphical and technical analysis platform TradingView:
- Create a free account and access to the various services.
- Click on the Chart tab and choose a pair to trade
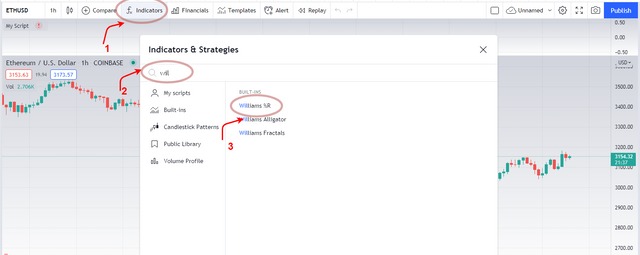
- To add the Williams Percent Range indicator:
1-- Select the "fx" button
2-- Type Williams in the search box
3-- Then choose “Williams %R”
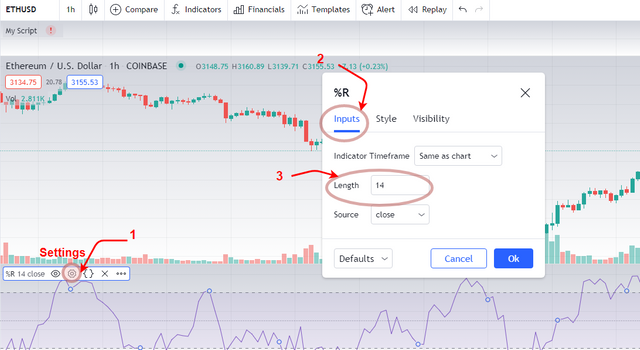
As you can see, as a standard setting of periods for the WPR, has 14 periods. This is the most used standard setting, as it is preferred by the creator of the indicator, Larry William. As already specified for other indicators, it must be said that this number of periods can (and perhaps should) change according to the type of instrument traded and according to one's own trading style (short term, very short term, etc.). Through the same screen on the TradingView platform you can set the number of periods you prefer. The number of periods should only be changed after a good series of tests, which can also be done through the demo mode of the same platform.

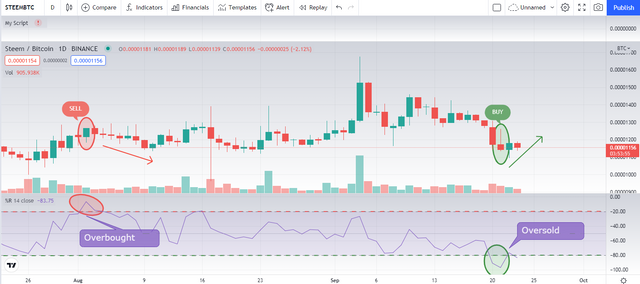
The "Williams Percent Range" or "% R" Technical Indicator is an indicator classified as an oscillator due to the fact that its values fluctuate between zero and -100. The graph of the indicator usually shows two lines, which are at -20 and -80, these values are to be considered as "danger" values.
The values that lie between -80 and -100, on the other hand, are values for the "Williams Percent Range" or "% R" technical indicator that demonstrate a very strong oversold condition, while the situation is different for values between -20 and 0, as in the presence of such a range we are in overbought.
As with all overbought or oversold indicators, it's best to wait for the crypto's price to change direction before placing your trades.
For example, if an overbought or oversold indicator (such as the Stochastic Oscillator or Williams'% R) shows an overbought situation, it is wise to wait until the crypto's price drops before selling it.
It is not uncommon for overbought or oversold indicators to remain overbought or oversold for a long period of time as the crypto price continues to rise or fall.
Selling just because the crypto appears to be overbought can cause you to exit the trade before its price shows signs of deteriorating.

A "failure swing" or oscillatory failure is formed when the indicator fails to rise above its high reference line (-20 by convention) in a bullish rally or conversely at fall below its low line (the -80 level) as part of a bearish rally.
This reversal denotes the weakness of the movement undertaken. If the indicator stops rising and turns around before reaching its high reference line, it shows the weakness of the upside and thus gives a sell signal. Conversely, if the indicator stops its fall and turns around before reaching its low reference line, it is showing weakness on the downside and giving a buy signal.
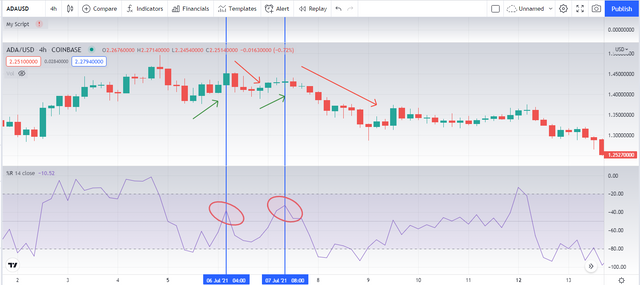
The figure below gives us a good example of "failure swing" on the indicator. On the latter we see where the red circles are drawn that the latter does not manage to pass its previous highest levels, from one red circle to another the trend weakens. The reaction was not long in coming and we recorded just after a severe correction on the price of the ADA / USD pair used for this example.
One of the particularities that make the Williams% R indicator so interesting is the trend divergences . Although they do not show up very often, when they do it is good to seize the opportunity, as they offer the opportunity to anticipate the next trend of an crypto's price.
A bullish divergence occurs when the indicator follows an uptrend as prices fall. This divergence indicates weakness among sellers and the prospect of a recovery. It is therefore a signal to buy.
A bearish divergence occurs when the indicator follows a downtrend while prices are rising. This divergence indicates weak buyers and a downside outlook. It therefore constitutes a sell signal.
The effectiveness of W% R, in such cases, is given by the fact that it highlights the moments in which a trend loses its strength, anticipating a probable reversal. Based on this, a trader can decide whether to open a long position , or opt for short selling .
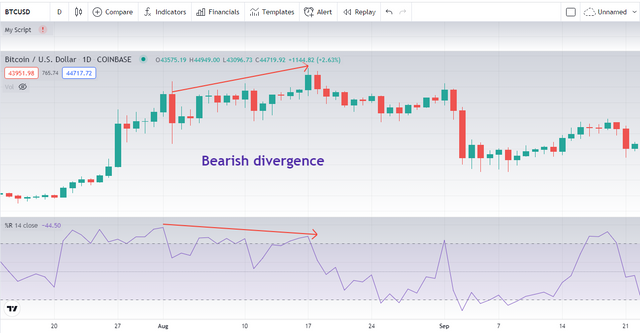
In the example below we have a magnificent bearish divergence materialized by an etiolation of the Williams% R as prices continue to climb. In the wake of this divergence, prices begin to correct.
To optimize their investments and ensure a winning technical analysis, one of the most common tactics among traders is the combo between the W% R and the EMA. In this second case, we refer to a really simple tool to apply to the graph. It is recommended to set it to 14 periods , so that it can correct any false signals.
Thanks to the graph obtained from TradingView , it is possible to have a clearer idea of what has just been stated:
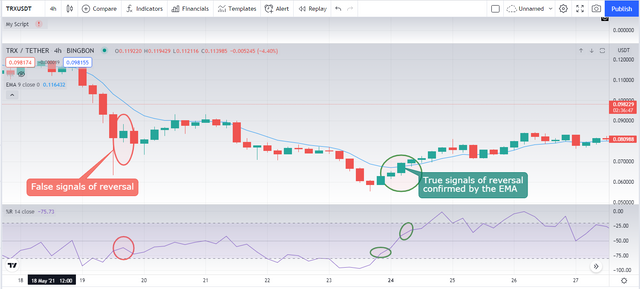
The image here shows two examples, in the first case, it can be seen that the use of the Moving Average has proved important to avoid false signals: the EMA does not accompany the William Percent Range oscillator. In the second example, the strategy becomes even more effective: the 14-period Exponential Moving Average shows a reversal signal as also reported by the W% R indicator.
Warning : before investing, you must always wait for the EMA to confirm the signal received from the momentum oscillator. For investors who prefer faster strategies, it would be advisable to consider using additional trend indicators .

Pros of the Williams Percent Range indicator :
- Indicator to be used at different time intervals
- Can be used in various markets
- Indicator response speed
- Compatibility with other indicators
Cons of the Williams Percent Range indicator :
- Necessity of integration with other indicators
- A large number of generated signals

In the course, one of the most popular and truly effective online trading indicators in the field was examined : the Williams Percent Range. Undoubtedly, it is one of those to be used to know the direction and strength of a trend, but above all from which to start to define the over-bought or over-sold market areas.
Thanks to the data obtainable from this oscillator, even more clear and precise if several of them are combined, traders will have the opportunity to operate following the current market situation. Although it is concretely a valid tool, one should not underestimate the trading platforms that you choose to undertake your business.
In fact, this is the first step to guarantee a safe and, over time, profitable online trading path thanks to quality tools such as Williams% R; a real ace in the hole to read and interpret the markets.

1. Explain the Williams %R indicator by introducing how it is calculated, how it works? And what is the best setting? With justification for your choice.
2. How do you interpret overbought and oversold signals with The Williams %R when trading cryptocurrencies? (screenshot required)
3. What are "failure swings" and how do you define it using The Williams %R? (screenshot required)
4. How to use bearish and bullish divergence with the Williams %R indicator? What are its main conclusions? (screenshot required)
5. How do you spot a trend using Williams %R? How are false signals filtered? (screenshot required)
6. Use the chart of any pair (eg STEEM/USDT) to present the various signals from the Williams %R indicator. (Screen capture required)
7. Conclusion:

Try to read the lesson and the assignments carefully before you start editing.
You must write an essay that contains at least 600 words.
Make sure that you post your homework into the SteemitCryptoAcademy community.
Use copyright-free images with mention of its source, if possible, produce your own.
Plagiarism is forbidden in Steemit Crypto Academy, and its perpetrators may face serious penalties.
This homework assignment will run until 2nd October'2021, Time- 11:59 PM UTC.
Include in your post among the first five hashtags #kouba-s4week4 and #cryptoacademy.
Users who are powering down will not be voted and considered excluded from participation.
Additionally, users with a reputation below 65 and/or haven't at least 600 SP in their wallet won't benefit from voting for their homework.


Cc:-
@steemitblog
@steemcurator01
@steemcurator02
Good day prof. Please, here is my entry below
https://steemit.com/hive-108451/@ckole/crypto-academy-season-4-week-4-homework-post-for-kouba01-crypto-trading-with-williams-r-indicator
Thanks for the lectures.
https://steemit.com/hive-108451/@chimezunem001/crypto-academy-season4-week4-crypto-trading-with-williams-r-indicator-homework-post-for-kouba01
Thanks for another interesting learning opportunity.
Respected Professor, can I submit my post? Please let me know so that I may start writing.
Do you have any issue? we usually start work as soon as the course is published.
Sir, I have shared my issue on your previous post of Summary of Week 2. Can you please read the message and reply me. I will be very thankful to you.
https://steemit.com/hive-108451/@kouba01/steemit-crypto-academy-or-summary-on-homework-task-week2-season4
Here is the comment link for your kind consideration.
https://steemit.com/hive-108451/@mawattoo8/r01dkw
I'll discuss this with @yohan2on but apparently he has his reasons for excluding you from upvote.
Respected Sir, Can I ask about the issue?
Wow amazing lecture full of learning as I have learned a lot of new things to catalyze my trading strategies with the help of the WPR.
Hey professor, a very good lecture from you as usual, but I have a doubt.
What working we should tell about in this section??
You have to explain the indicator mainly by these concepts but extensions for the same context are also allowed.
Thank you professor, I have one mote question, does EMA work as the dynamic support and resistance level when used with Williams %R.
Thanks prof for this wonderful lecture. I want to say a big thank you for making sure my post was visited after reposting. I'm grateful. One love.
Hi professor here is my entry post link
https://steemit.com/hive-108451/@mccoy02/crypto-academy-season-4-week-4-crypto-trading-with-williams-r-indicator
Sir, can i submit my post for your consideration? Is it possible for you to review my post?
Unfortunately, you have been disqualified from participating in the Academy .
For how long, I will stand disqualified.
In fig 4 chart you taken steem/btc chart but in WPR indicator you telling Over bough ETH ,over sold ETH .
By Mistake it occurs???
yeah by mistake i will correct it.
Ok
Thank you kouba01 for this course .