Crypto Academy Season 4 [ Advanced course ] week 2: Crypto Trading With Volume Indicator

There is no doubt that using technical analysis exponentially increases a trader's chances of profit. There are a real infinity of technical analysis tools, and every trader is always able to find the one that best suits his trading style and term of operation (short, medium or long term).
In addition to technical analysis, we must not forget about everything else: such as trading volumes.
Being able to analyze and interpret crypto trading with volume can be a great help in making more accurate trading decisions. And therefore even more profitable. For this reason, we have decided to create a special article, where we will explain in detail what trading volumes are and how a trader can interpret them and take advantage of this information.

Volume is an important technical indicator that should be used on every cryptocurrency price chart. The volume indicator corresponds to the number of assets traded over a given period of time. It is a key indicator of market activity and its liquidity.
This information is usually represented by vertical columns at the bottom of the graph. Higher volume bars mean that there was more trading activity during the time period in question, while smaller columns indicate lower trading activity.
Volume is a real-time indicator that can also be viewed as the level of investor interest in a particular cryptocurrency at a given price. For example, it is not uncommon to see volume spikes after a significant news event or when reaching support or resistance price levels.
As with all technical indicators, there are several ways to use volume in a cryptocurrency trading strategy. Most crypto traders who use technical analysis display volume in combination with other indicators. The volume is then used to confirm the strength of the price movement.

The volume indicator is extremely easy to configure as it only has a few options. The source of the volume is specific to the exchange represented in the chart as below with the Tradingview platform. Each column represents the total volume of the corresponding candle or bar as you can see on the ETH/USD chart below.
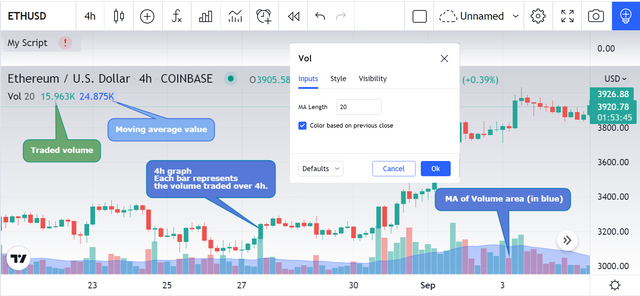
On a 4 hour chart, a volume bar represents the total trade volume for those 4 hours. On the daily chart, a volume bar represents the total assets traded for that day.
It is possible to add a moving average on the volume indicator. For example, with a specific time period, an MA value of 20 would produce a moving average based on the previous 20 volume bars.
The colors of the volume indicator also have meaning. A green volume bar means that the volume for that period closed higher on this candle than on the previous candle. A red volume bar means that the volume closed lower on that candle than on the previous candle.

The volume level measures the intensity of the price movement. A larger volume indicates a greater degree of pressure in the direction of the trend.
By monitoring the volume level and price movements, it is easier to gauge the buying or selling pressure in the changing market. You can use this information to confirm price movement or to warn that price movement is unreliable.
As a general rule, the volume should increase in the direction of the current price trend.
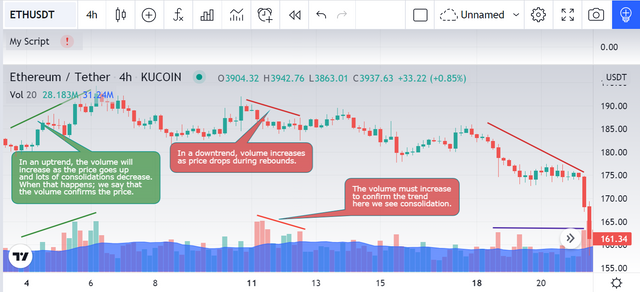
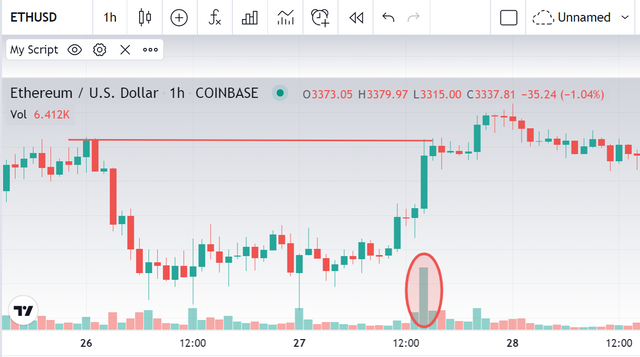
- In an uptrend, the volume should increase as prices increase and decrease as prices fall. When this happens, the volume is supposed to confirm the price. You can see it in the ETH / Tether chart below.
- In a downtrend, the volume should increase during downward movements and decrease during rebounds. As long as this trend continues, it means that the selling pressure is greater than the buying pressure and the downtrend should continue.
When that price-to-volume ratio starts to change, it's time to start looking for signs of a reversal.
By monitoring price and volume, you are actually using two different tools to measure the same thing: market pressure. As the prices are on the rise, you can see that there is more pressure to buy than to sell. It is for the same reason that the increase in volume should be in the same direction as the current trend.
Technical analysts believe that volume precedes price, which means that the loss of upward pressure in an uptrend or down in a downtrend will show up in the volume numbers before a trend reversal price.

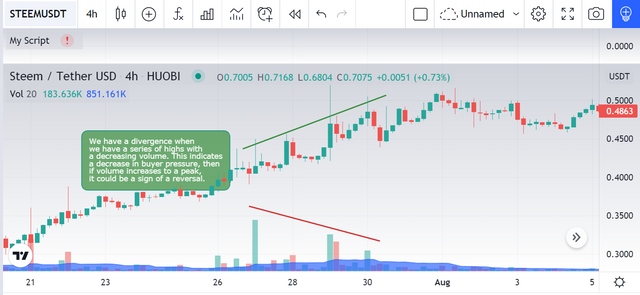
Volume divergence occurs when prices reach a high on a falling volume, indicating a decrease in buying pressure. If the volume increases after a small correction, then the uptrend may end. Watch the volume divergence on the Steem / USDT chart below.
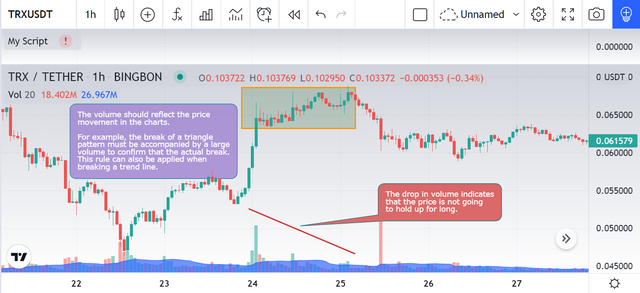
The volume should also reflect the price movement in the charts. For example, the breakout of a triangle pattern must be accompanied by a large volume to confirm that the breakout is real as can be seen on the TRX / USDT chart below. This rule can also apply when breaking a trendline.

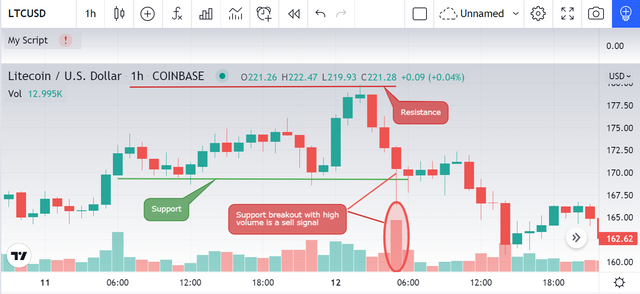
When nearing price to support or resistance, it is important to study trade volume as this can help you validate your strategy or not.
- Take the example of a support breakout with falling prices.
In the event of a support breakout, it is important to study the trade volume, as low volumes will put pressure on the downtrend.
Indeed, if the volume exchanges are weak during a break in support, it is because there are not enough buyers.
However, if the support is broken with high volume, it portends a strong downtrend as shown in the example on the LTC/USD chart below.
- Take the example of a resistance breakout with rising prices.
If the volumes are low on the breakout, then there is a high probability that a correction will come afterward as the low volumes show that the buyers have not had the capacity to support the prices.
It is therefore important to check in your trading strategies that crossing resistance is accompanied by high volumes.

Price corrections to the main trend of the price can be observed by comparing it with the volume of the volume. If we assume that the price is moving upward and then a correction of the price occurred and the price started moving in a secondary direction opposite the main price direction, then in normal cases a decrease in the volume occurs with the correction of the price, or it decreases before The completion of reversal technical patterns such as the head and shoulders before the price exits these patterns.
The main trend is bullish with strong momentum, and we notice the correction in the price was with a lower trading volume, after that the price returned to the main bullish trend with a higher trading volume than the previous one.

Another important indication that can be received from the volumes concerns the formation of extreme peaks, which often indicate an imminent reversal.
In general, these spikes occur when the price approaches resistance and supports.
In these cases, in fact, the interest of traders increases, and many enter the market and actively participate. This generates a strong increase in volumes, which can often constitute significant obstacles for the price course, and therefore an indication of a possible rebound on the support/resistance, as happens in the example below.

The on-balance volume is an indicator that signals the buying or selling pressure. It is much easier to visually understand the buying or selling pressure using this indicator than the volume chart.
This indicator can be used as confirmation of the quality of the trend or as a warning of an impending reversal when it diverges from the price trend.
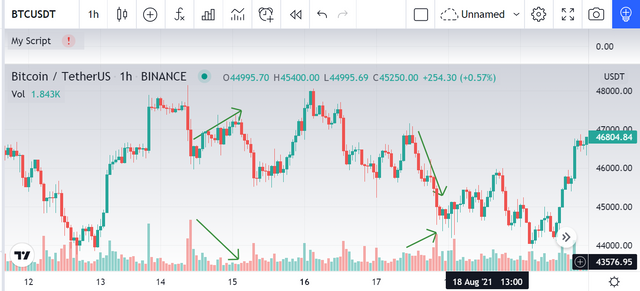
On the BTC/USD chart below, a growing obv (increase in buyer pressure) confirms the upward trend and a decreasing obv would confirm a bearish trend.
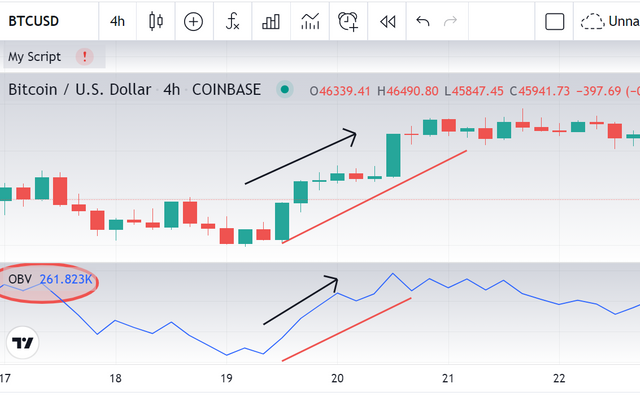
The construction of this indicator is very simple to the total daily volume is assigned a positive or negative sign depending on whether the closing prices are higher or lower than those of the previous day. A higher close gives the volume a positive value while a lower close gives the volume a negative value. The total sum is updated by adding or subtracting the volume each day based on the direction of the close.
Support and resistance levels can also be used in the OBV line.
Divergence occurs when the volume line moves in a different direction than the price, signaling a possible trend reversal.

Pros:
The volume indicator is one of the sources of information traders use to measure market pressure.
Its main advantage is its ability to provide clear and simple signals to interpret market sentiment.
Cons:
The drawback of this indicator is that despite the relevance of its indications, the volume as the only indicator does not really give any input or output signals that can be directly exploited.
Indeed, it is often necessary to supplement the signal given by this type of bar chart, using another technical indicator that will allow us to identify an interesting input signal.

As you can see, there are several readings used in the volume indicator. It can be used in any market and in any time frame. It is also a useful indicator to use to quickly scan various charts to identify potential trading opportunities and determine price direction. But as with any technical indicator, this volume indicator should not be used in isolation from other technical analysis indicators and preferably used with moving averages, trend lines, MACD indicator and resistance support. The skill of reading the volume indicator to benefit from it in determining the direction of prices requires a lot of practice.

1. Explain the volume indicator in your own words.
2. Use a platform other than Tradingview to present the volume indicator on a chart and show how to configure its parameters by justifying your choices. (Screenshot required)
3. What is the link between Volume and Trend and How to use volume to predict a trend reversal? (Screenshot required)
4. How to use the volume to have a signal confirmation? (Screenshot required)
5. How does the volume reflect the evolution of prices in the charts and why does the volume sometimes anticipate the price? (Screenshot required)
6. Is it better to use the volume indicator alone or use it in parallel with another indicator when trading? Justify your answer
7. The volume indicators are multiple, choose one of them to briefly explain its usefulness in crypto trading.
8. Conclusion:

Try to read the lesson and the assignments carefully before you start editing.
You must write an essay that contains at least 600 words.
Make sure that you post your homework into the SteemitCryptoAcademy community.
Use copyright-free images with mention of its source, if possible, produce your own.
Plagiarism is forbidden in Steemit Crypto Academy, and its perpetrators may face serious penalties.
This homework assignment will run until 18th September'2021, Time- 11:59 PM UTC.
Include in your post among the first five hashtags #kouba-s4week2 and #cryptoacademy.
Users who are powering down will not be voted and considered excluded from participation.
Additionally, users with a reputation below 65 and/or haven't at least 600 SP in their wallet won't benefit from voting for their homework.


Cc:-
@steemitblog
@steemcurator01
@steemcurator02
A very comprehensive lecture as usual.
I want to know, can we use trading view for question other than Q 2 ?
I prefer that you discover another platfrom of trading.
Thank you for your work professor @kouba01, you are an old hand here and we are not expecting less.
Your lecture is down-to-earth.
Thank you once again.
I thought I would join the advance class this period after fighting so hard to reach reputation 60 the previous season. However, the adjustment killed that hope and I felt battered.
Meanwhile, I hope to participate in your homework task someday.
While I am not here to dispute or disagree with the management, some adjustments do have some kind of emotional toll on the students.
Some of us have been an old student who are hoping to make progress rather than stock in the same circle every time.
It is like when you ask your child to climb up to a point, he became excited about the process, when he gets to that target thinking that be has won you then raise the ladder.
This can frustrate the child.
There is this natural psychological impact progress has on people, this should not be undermined.
All the same, whatever happens, we still want to grow with #steemit.
@sapwood
Buenas tardes profesor @kouba01, tengo una duda que me gustaría aclarar.
Quiero hacer una delegación de SP a la comunidad latina, ¿si mi SP llega a ser menos de 400 después de la delegación (200 en billetera y 600 delegados) puede seguir siendo elegible para las tareas intermedias?
Hello Sir @kouba01,
Please my homework submission,
https://steemit.com/hive-108451/@elyon/crypto-academy-season-4-advanced-course-week-2-crypto-trading-with-volume-indicator-by-elyon
Excelente conferencia profesor. Gracias por compartirla y ampliar nuestros conocimiento sobre los indicadores
This is such a nice lecture excellently delivered. Thanks prof
Gracias por su conferencia...
Academic Master is a US based writing company that provides thousands of free essays to the students all over the World. If you want your essay written by a highly professional writers, then you are in a right place. We have hundreds of highly skilled writers working 24/7 to provide qualityessay writing services to the students all over the World.
Excellent lecture professor. In question 2 would using binance be ok? Also in other questions can we use Tradingview?
I prefer that you continue with Binance platform.
hello professor, I have finished my homework that I have been struggling with for days. Thank you for giving us this assignment.
https://steemit.com/hive-108451/@svm038/crypto-academy-season-4-advanced-course-week-2-crypto-trading-with-volume-indicator-or-by-svm038
My!!! I was too, I swear 😂 but after reading a pair of times I think I finally got the essential theory for this topic. Regards from Latin America 🌎 #venezuela #affable