Steemit Crypto Academy | Summary On Homework Task Week1-Season5
November 20, 2021 was the deadline for the first week of Season 5 to accept homework, I would like to thank the 35 students who tried and worked this week by submitting their essays to answer the assignment and to get the highest ratings.
This week we introduced the ATR (Average True Range) indicator which is one of the essential indicators in online trading: it is on all platforms, and knowing how to read and interpret it in the right way is really the distinction between a successful investment and a failure.
It is an indicator that allows you to graphically view changes in the volatility of a security, or, once a certain period is set, how much the price has changed during that time limit.
The ATR indicator is designed to be combined with other indicators and to make analyzes more accurate, especially, as we will see later, to identify risk margins and determine the correct investment management.
I hope that all users who have studied this week will benefit from the set of information and analysis provided to use about how much of an asset is usually moving in a given period of time to set profit targets and decide whether or not to try trading.
We always state that the main objective of our Steemit Crypto Academy community is to ensure knowledge and promote opportunities for quality learning that are equitable and inclusive in the cryptocurrency field for all.
Next, I asked the students a few questions to assess how well they understood the topic and to assess the cognitive gains they made from reading the lesson.
The questions to be answered are:
1. Discuss your understanding of the ATR indicator and how it is calculated? Give a clear example of calculation
2. What do you think is the best setting of the ATR indicator period?
3. How to read the ATR indicator? And is it better to read it alone or with other tools? If so, show the importance. (Screenshot required)
4. How to know the price volatility and how one can determine the dominant price force using the ATR indicator? (Screenshot required)
5. How to use the ATR indicator to manage trading risk ?(screenshot required)
6. How does this indicator allow us to highlight the strength of a trend and identify any signs of change in the trend itself? (Screenshot required)
7. List the advantages and disadvantages of this indicator:
8. Conclusion:
Discuss your understanding of the ATR indicator and how it is calculated? Give a clear example of calculation.
One of the best known and most applied oscillators is undoubtedly the Average True Range (ATR indicator). It was developed by John Welles Wilder, with the main purpose of measuring the volatility of an asset.
Its goal makes us understand right away that it is not used directly to predict in which direction the price will go, but only how strongly it moves in one direction (up / down).
It is precisely for this reason that the use of the ATR indicator in technical analysis is always done with one or more other instruments, in order to have a complete overview of the market.
As the name suggests, the Average True Range indicator is a moving average calculated over N periods (usually 14) of the so-called "true range", which now let's see what it is ...
The True Range :
For educational purposes only, we show you how to calculate the “True Range (TR)” which is the heart of the ATR indicator.
We can define it as follows: the True Range is given by the maximum movement recorded by the price of the current day or by the comparison between the close of the day before and the extreme reached on the current day.
The latter is defined by three elements:
- difference between the maximum price of the day and the current minimum
- difference between the current maximum and the closing price of the day before
- difference between the closing price of the day before and the current minimum price
As mentioned, the trading platform will do all the calculations for you. What you need to know is that the ATR oscillator gives you a measure of market volatility.
It tends to fluctuate upwards when the market is very volatile, whereas it flattens out in the presence of a market characterized by low volatility.
Not only that, it is not uncommon for market turning points to occur near the lows reached by the Average True Range indicator.
How to know the price volatility and how one can determine the dominant price force using the ATR indicator? (Screenshot required)
First of all, we need to clarify why it makes sense to use the ATR indicator to know the price volatility and improve your trading strategies.
The logic is very simple: as the master John Bollinger (creator of the famous Bollinger bands) would say, you always have to check whether you are facing a period of high volatility or low volatility, because high volatility generates low volatility, and vice versa. .
From this concept, we must always have under control what is the level of implied volatility of the price, because if I understand that a certain volatility generates the opposite, then I will be ready to profit from the price movements or possible breaks. in the trend.
When following a sharp rise in ATR, expect a rapid movement in the markets, such as when the bollinger bands break apart.
The Average True Range (ATR) indicator can be used to measure the volatility of an asset, as is the case with bollinger bands, for example the ATR indicates low volatility during market range periods.
The rule concerning the dominant force
What you are about to read is the main rule for determining whether a chart has a dominant trend up or down, of course, then we will draw our secondary conclusions.
Check which price direction is followed by the increase in volatility.
Remember that strong trends must be accompanied by increasing volatility, if on the contrary the price moves in a directional manner but is not accompanied by an increase in volatility, it means that the trend is not so strong.
Therefore, we can say that the dominant force (upward or downward), in a given chart trend, will be that which is accompanied by the increase in volatility, i.e. increase in ATR indicator.
How to use the ATR indicator to manage trading risk ?(screenshot required)
One of the ways you can use the Medium True Term strategy is to identify potential points where you can set trailing stop-loss or trailing stop-loss orders. With this indicator, you can avoid the possibility of placing a tight stop loss in times of high volatility or a very wide stop loss during low volatility. ATR when placing a stop loss order.
White arrows show periods of increased volatility with relevant price movements during high volatility (white circles). By incorporating the ATR indicator into your trailing stop loss decisions, you will ensure that the profit is locked in and that you do not set a tight stop loss, which will result in a premature exit.
In times of low volatility (sideways market movement), you can set an appropriate stop loss, which is tight enough to ensure that you get a certain level of profit. You can use the value of the ATR indicator as a base for setting your trailing stop loss, which is useful because every time the volatility moves, the stop loss moves as well. When price action changes are not in your favour, a stop loss can be activated based on the set distance from the ATR value.
Apart from these popular applications, traders have developed many medium true range strategies to identify and confirm potential profitable signals. Besides the Average True Range, it also includes the Moving Averages indicator to determine the direction of the trend or the Relative Strength Index to measure the momentum.
The stop loss ATR indicator trading strategy can be set when you set the stop loss order below or above the levels of support and resistance. The stop loss distance from the value of the ATR is usually set by traders at 1, 2 or 3 times the value of the ATR. Of course, this does not mean that this should be taken as a rule, because traders create their own true range trading strategies in addition to their own general trading strategy.
How does this indicator allow us to highlight the strength of a trend and identify any signs of change in the trend itself? (Screenshot required)
Be using the ATR indicator to find potential breakouts. Try to monitor the value of the ATR and look for a low value for several years. When you find such a point, look for the price to break the support level, which will be an indication that volatility will increase and the breakout may appear.
Traders can use the ATR indicator to identify potential entry and exit points for their trading trades. Keep in mind that periods of high or low volatility will eventually come to an end, and you can use that to your advantage. For example, after a period of low volatility, traders expect volatility to increase and this could be a point where you enter or exit your position.
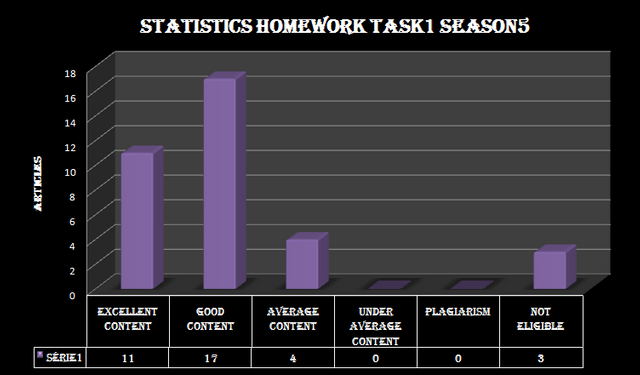
The first week of the fifth season, which took place from November 13 to November 20, 2021, witnessed a decrease in the number of participations due to the change in the terms of this season in order to urge users to raise the level of their reputation and influence from SP for the benefit of the platform and users alike.
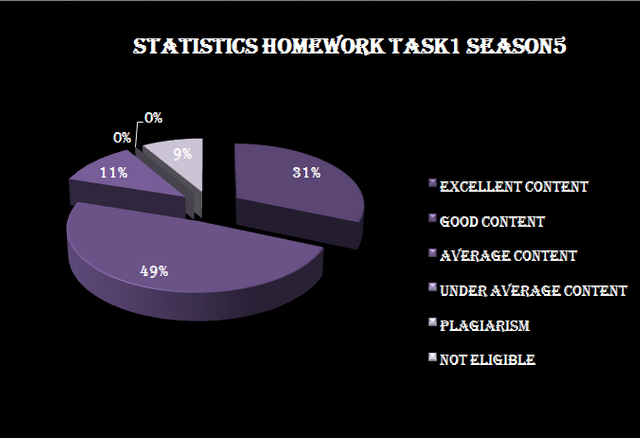
We note the availability of articles with excellent content, which represents 31% of the total writing, with a high percentage of articles with good content reaching 49%, as well as articles with medium content, they are ranked at 11%.
The percentage of successful homework with a positive overall vote thus exceeded 91% versus 0% who failed to score above average, if that is anything to say, the seriousness with which students get what is asked of them and how eager they are to learn And do the best to get the highest score and the best results.
We also see 0% of plagiarism posts that we are looking to combat and it remains our great hope that students will continue to write articles without these practices which remain the number one and most important enemy towards improving their level and developing their knowledge.
9% were classified out of the competition due to non-compliance with the conditions of participation, and we must remember that the conditions of participation require a reputation of 65 and 900 SP with adherence to the expiration time and fulfillment of the conditions of participation in the #club5050 event, so we invite participants to abide by them. Conditions so that no preparation effort is wasted without obtaining evaluation and reward.
We would like to first thank all the participants for their challenges and inspiring achievements, and we hope that the spirit of this competition will continue for as long as possible, and we hope that the culture of challenge and facing obstacles will spread in all communities.
We are pleased to announce the names of the three winners of the 1st week of the 5th season competition :


Cc:-
@steemitblog
@steemcurator01
@steemcurator02
😏👍
Contento de haber hecho un buen trabajo en una clase muy interesante y de mucho aprendizaje.
Have a Happy #club100 Day 😀
I am grateful it is a wonderful gift.
Thank you!