TRADING WITH ACCUMULATION/DISTRIBUTION (AD) INDICATOR/ CRYPTO-ACADEMY S4W5 HOME-WORK POST FOR @ALLBERT.
INTRODUCTION
Trading using various Indicators have been at the fore-front of many investors today as we speak, there are many instances where you can trade without the help of an indicator, but for me I think using Indicator is very important as it will assist you to confirm various price movements, not just using an indicator but using multipleIndicators to confirm price movements.
Trading is very risky so you need a proper risk management system to minimize your looses, there is absolutely nobody who doesn't loose money while trading but the advantage should be that your profit should be greather than your looses.
And this can only be achieved if you galvanize your strategy very well and get ready to Explore the volatile Market, this brings us to the topic point of the day Which is the use of Accumulation/distribution (AD) Indicator.
EXPLAIN IN YOUR OWN WORDS WHAT THE A/D INDICATOR IS AND HOW AND WHY IT RELATES TO VOLUME. (SCREENSHOTS NEEDED).
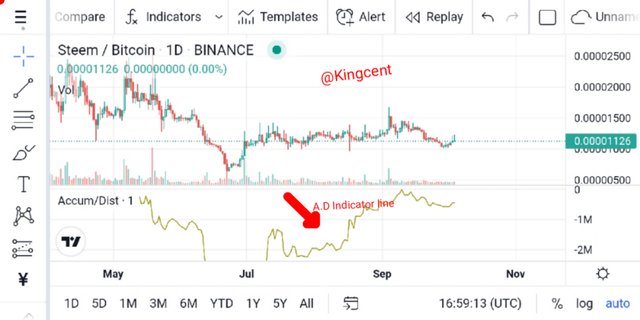
The AD Indicator which can also be called the Accumulation/distribution Indicator can be defined as an indicator that makes use of volume, in conjunction with prices to justify the efficacy of stock been accumulated/distributed, in a long run it also detects divergence.
As we may know there are sometimes when trend moves in opposite direction with the Indicator been used, this justifies the strength that trend exibits.
KEY POINTS TO NOTE
The (AD) lines has a responsibility of guaging demand and supply, of various assets thereby accessing closing price, within a specific period multiply by the volume.
Accumulation Indicator is cumulative in nature, this means a period is added or deducted/subtracted at the last phase.
whenever (AD) line raises it assists to confirm an uprise in trend movement bullish, and whenever the lines falls it confirms potential downtrend bearish.
ACCUMULATION DISTRIBUTION RELATIONSHIP WITH VOLUME
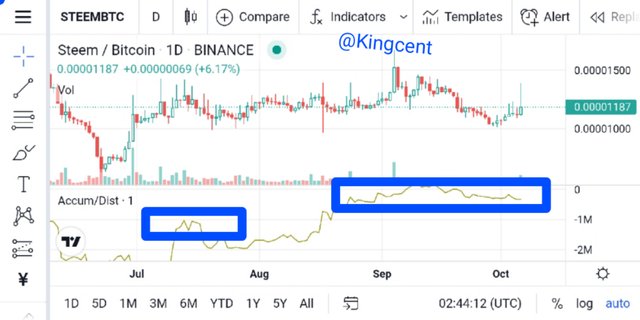
Whenever calculations are done on A/D Indicator it gives an insight on the viscosity of buying and selling and how solid they appear at a particular time, this is been executed by knowing where price closes be it at the close or near the upper or lower phase of the range, at this section it will be multiplied by the volume, it will result to a massive throw-front.
Looking at the possible alternative, now let's say price reaches looking to finish closer to the high, near the range and the volume in question is low, or possibly if the volume appears been high, and the price tries to o climax near the middle of the range, this will make the A/D, Indicator to range up.
Now let's say price makes a close at the lower portion of the price range, where the price makes a close and volume will determine how the A/D line is going to fell.
THROUGH SOME PLATFORMS, SHOW THE PROCESS OF HOW TO PLACE THE A/D INDICATOR (SCREENSHOTS NEEDED).
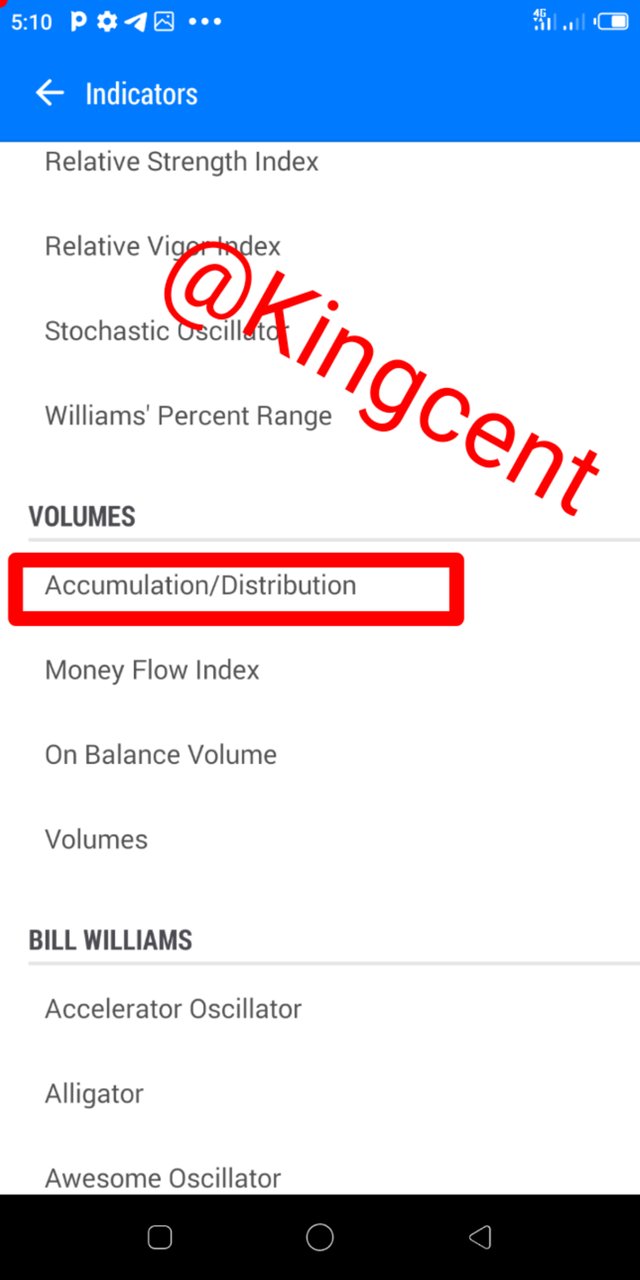
Showing how the A/D Indicator is been placed is very simple, here I will be exploiting the trading view App in my phone to execute this particular one.
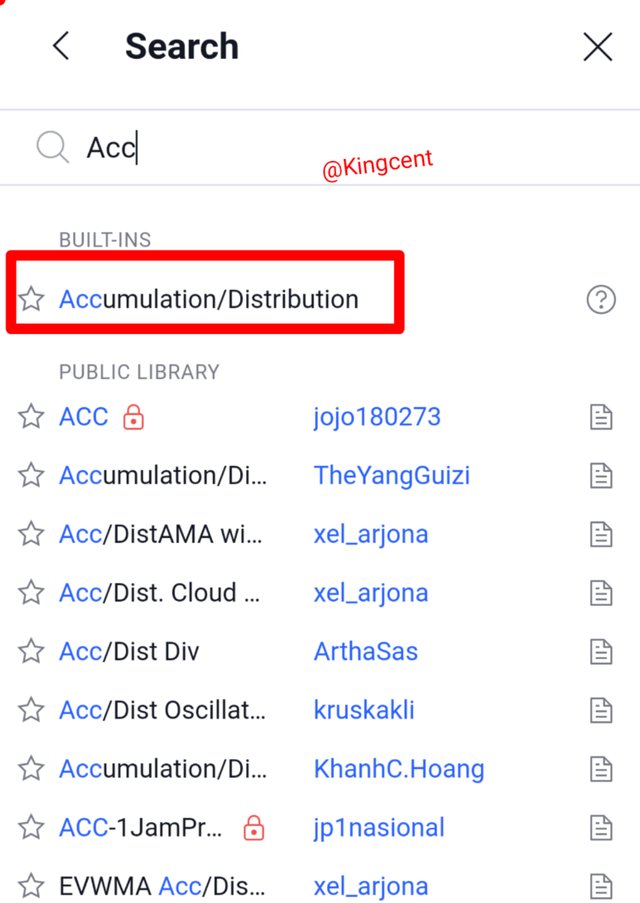
First you need to access the trading view App,open it and search for Accumulation/distribution, before you are done the Indicator will pop up on its own.
After then you click on it and proceed, then you go back to the chart, to confirm.
After that has be executed then you go back to Accumulation/Distribution, click on imput trying to add a time-frame.
At the left hand side you click on it and select your time frame, from my chart I clicked on 1minute.
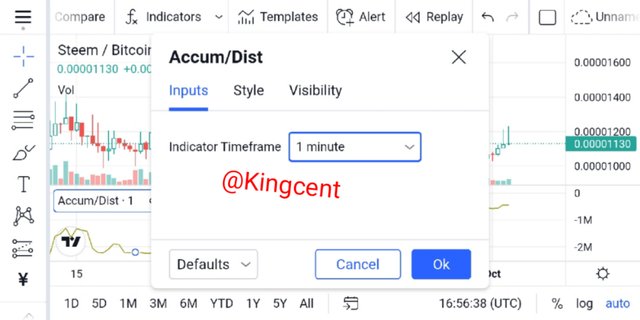
- After you are done clicking on it, you hit the OK botton, by so doing you have officially added 1 minute, as your Indicator time-frame.
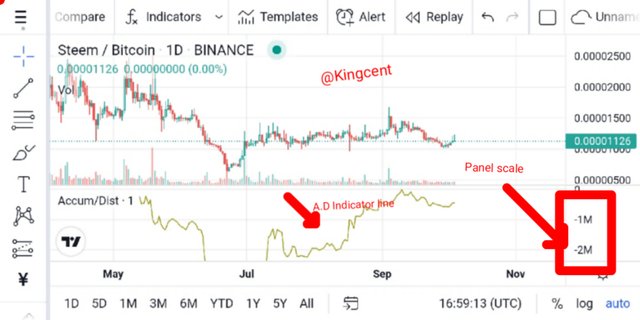
Another phase is the Indicator line, from the image uploaded you will find out that the Indicator line moves as price moves.
Indicator are basically used to confirm price movements and thus trends confirmations, adding 1 minute Indicator time-frame sees it all.
- From the chart uploaded you can see the Indicator line as clearly showned, at the latter stage, price is going bullish after series of highs and lows.
EXPLAIN THROUGH AN EXAMPLE THE FORMULA OF THE A/D INDICATOR. (ORIGINALITY WILL BE TAKEN INTO ACCOUNT).
Accumulation distribution A/D lines, are basically used to confirm Security trendings in the market, now let's say a security is exhibiting strong Uptrend or downtrend, then the A/D line starts diverging, that is moving in opposite direction with price, this may be indicated as Bullish or bearish signals.
Now let's say security price is showing downtrend and A/D, line is showing Uptrend, this means buyers will dominate the market, and a reversal will occur in no time. reversal will occur and uptrend begins.
Now let's say the security price is basically showing uptrend and the A/D, line is signalling downtrend, this means buyers have more pressure, in no time reversal will occur and downtrend will begin.view this screenshot for clear understanding.
[MFM= Close-low-high/high-low]
Calculating using the formular we have the following.
MFM= this means Money flow multiplier.
close= close means closing price.
Low= this signifies low price acrosss the period/for the period.
High= high price across the period/for the period.
We have known about the various highs, lows, and closes, now let's talk about the money flow volumes.
MFM, multiplied by the period volume gives you the money flow volume, by this we have it like this.
Money flow volume is seen as=MFMxvolume period.
A/D= last A/D + CMFV
At this time CMFV will then change becoming the present period money flow volume.
Now let me highlight how to calculate the A/D lines. From the chart I uploaded you will find out that Accumulation distribution has a line, pay attention very well to get details about the lines.
First you calculate the various multiplier's, remember the rescent periods is usually closed, high, or low, so you calculate then.
the current period and it's volume is very important, and you should consider then while calculating, volumes are basically used to calculate the money flow.
The money flow volumes is usually added to the accumulation distribution value, at the first phase, and money flow valume should be used as a result of the first value.
Whenever each period ends you Carry out addition and subtraction (+ -), Courtesy the newest money flow volumes.
In summary the formular of an A/D Indicator becomes.
[MFM= Close-low-high/high-low].
HOW IS IT POSSIBLE TO DETECT AND CONFIRM A TREND THROUGH THE A/D INDICATOR? (SCREENSHOTS NEEDED)
It's very possible to detect and confirm trendings in the market, remember when market moves it moves in a zig-zag manner, forming series of different highs, and low, whenever this zig-zag form occurs we detect trends, trends assists you to detect when to enter and exploit the market, we call it snipa entry.
If you are able to plot your snipa entry very well you will know your entry and exit point very well by so doing you will control the market trends. Whenever market fluctuates new trends comes to fruition, at this phase I will advice you draw your trend-line so that whenever new trends occurs breaking your trend-line then you enter the market be it for a buy or for a sell.
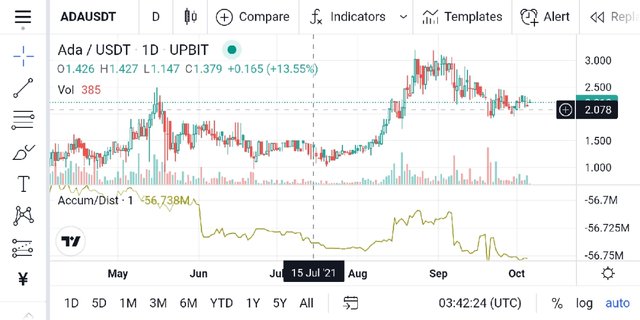
Let me show you a screenshot and explain how to detect and confirm trends.
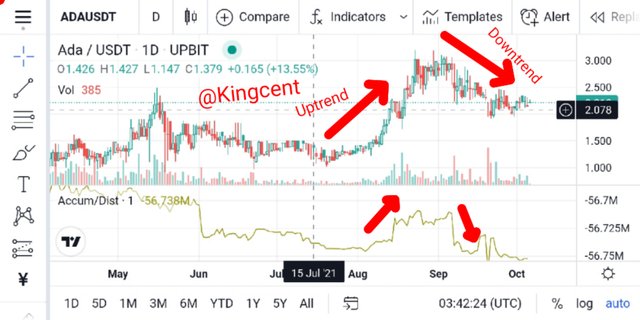
The chart above is ADA/USDT, from the chart I spotted uptrend and downtrend, uptrend is when the current highs surpass the previous highs, when this occurs in various ocassion's you should be aware that a downtrend is about to happen so as an experience trader you draw your trend-line, waiting for a break then you enter the market from there.
Downtrend is when price starts forming lower high or lower low, then a potential downtrend has kick-started, what you need to do at this stage is to draw another trend-line monitoring when price will break the previous highs I mean from the point where you officially drew your trend-line from. A candle-stick needs to close below the previous one signalling for a change in trend.
Through a DEMO account, perform one trading operation (BUY or SELL) using the A/D Indicator only. (Screenshots needed).
I will be using my MT5 Demo account to perform this task, I will buy crash along the process indicate my Take profit zone.
- First I added my Indicator to chart, which is the accumulation distribution, you can see it clearly from the image uploaded.
- Looking at the image below, I bought crash 500 using 0.20 lots size, and I waited for a while before closing positions and collecting my profit.
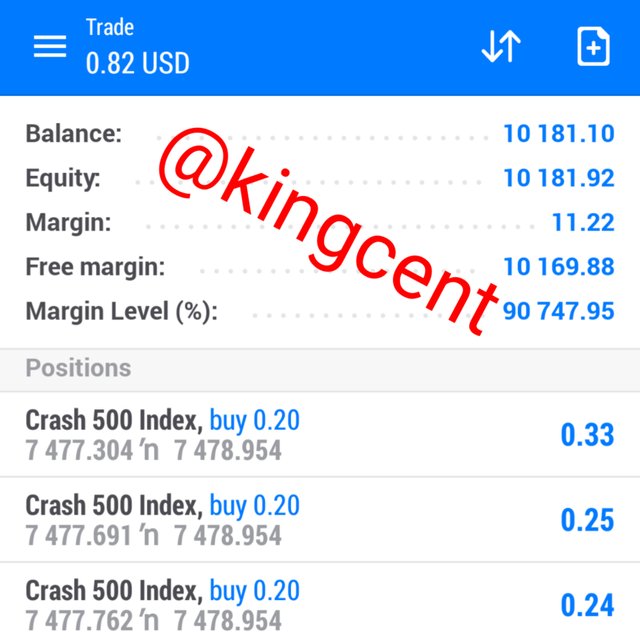
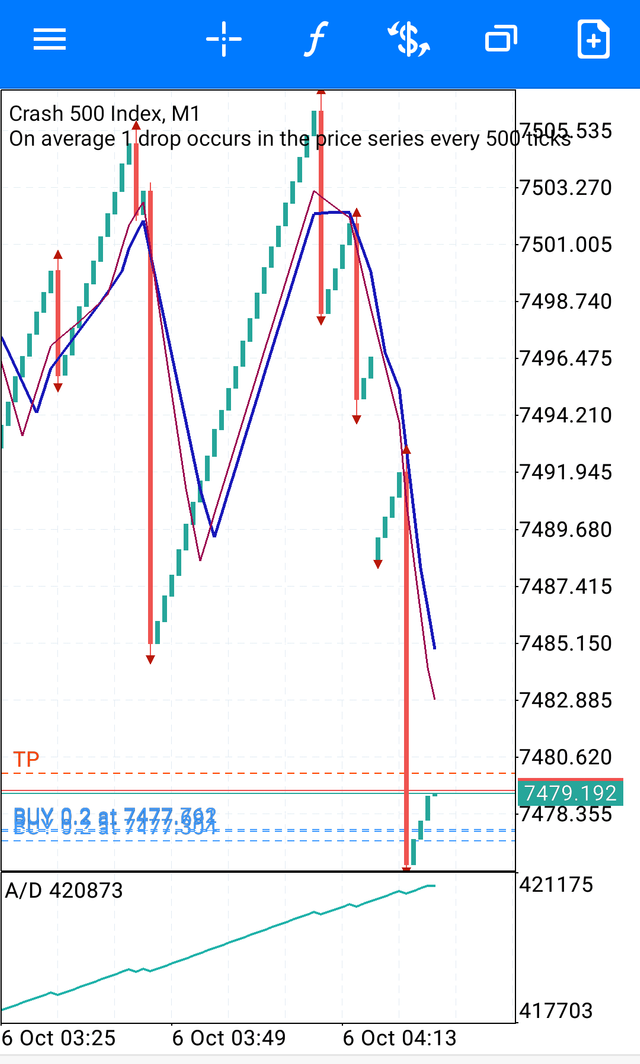
As trend-lines moves, it moves in conjunction with price, so what I did was to indicate the point where I want to take my profit.
One thing you should understand is that the higher the lots size, the higher your chances of getting quicker profit, 0.90 lots size, moves faster than 0.30, lots size that is how it works.
Now take a good look at the A/D, Indicator line, you will understand that it moves together with trend. As price approaches downtrend the A/D, Indicator line will bend.
WHAT OTHER INDICATOR CAN BE USED IN CONJUNCTION WITH THE A/D INDICATOR. JUSTIFY, EXPLAIN AND TEST. (SCREENSHOTS NEEDED).
It's optional so many other Indicator can be used in conjunction with the A/D, Indicator for price confirmations, as the lectures goes front I will add two other Indicator with the already existing A/D Indicator and see the reactions it will show Courtesy price movement.
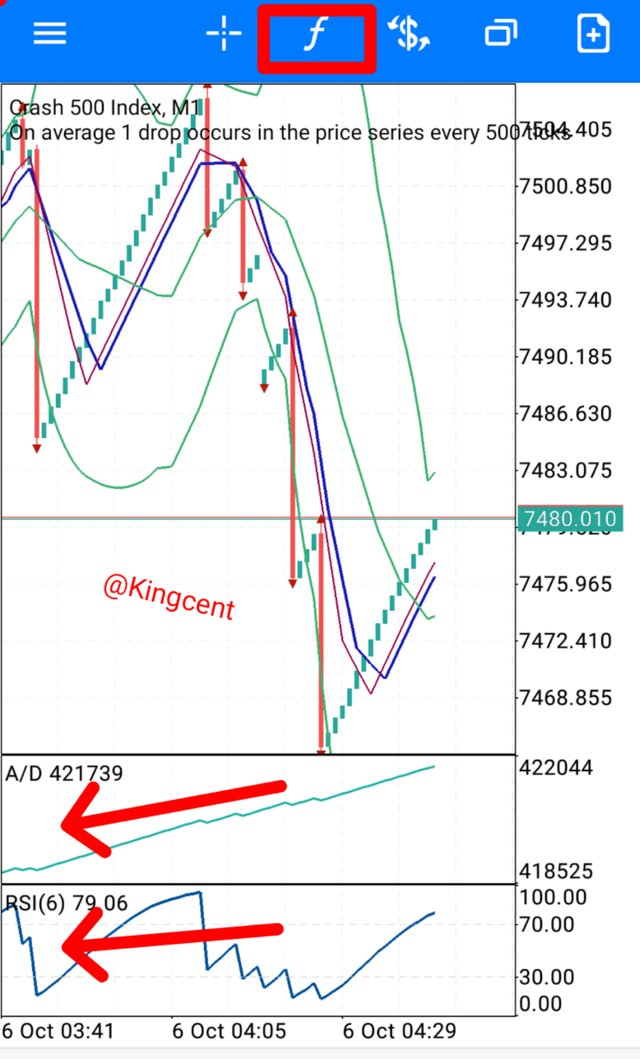
Looking at the chart below I added another Indicator namely the RSI, and the Bollinger bands, to add an indicator you click on the f, sign and select the Indicator you feel like adding, now looking at the chart let's see whether the Indicators corresponds with price movements.
Looking at the three Indicator you will understand that divergence isn't occuring, the RSI is 79, meaning it's in the Overbought region, so you don't buy there instead you collect profit, Bollinger bands, are pointing upwards signalling an Uptrend, the A/D, is pointing upwards signalling an Uptrend too, so you can see that the three Indicators are pointing in one direction.
CONCLUSION
From my homework task I was able to highlight that A/D, which can thus be called the Accumulation distribution, can be defined as an indicator that makes use of volumes, in relation with price in order to justify stock that is been accumulated or distributed. I also highlighted that in most cases price/trend moves in opposite direction with the Indicator been used at this phase divergence occurs.
I showed how to add A/D in chart, I also hinted that A/D, lines are basically used to confirm Security trendings in the volatile market, now let's say a security is signalling a strong Uptrend or downtrend, the A/D line will thus assist you know buyers and sellers are very active in the market through strong Uptrend or downtrend.
Other Indicators can be used in conjunction with the A/D, Indicator with the sole motive of price/trend confirmations, from my homework task I tried using it with other indica like the RSI, and the Bollinger bands, it pretty much have me the Same answer. Many thank's to you professor @Allbert
Hello @kingcent Thank you for participating in Steemit Crypto Academy season 4 week 5.