Crypto Academy / Season 3 / Week 4 - Homework Post for Prof @reminiscence01 / Candlestick Patterns by @kelechisamuel
The lesson today is based on the psychology, formation and explanation of Candlestick patterns.
In your own words, explain the psychology behind the formation of the following candlestick patterns.
Bullish engulfing Candlestick pattern
Doji Candlestick pattern
The Hammer candlestick pattern
The morning and evening Star candlestick pattern.
Now, I am to explain the formation and psychology of some candlestick patterns as we see below :
The Bullish Engulfing Candle stick pattern :
The Bullish Engulfing Candle Stick pattern could be seen as a chart situation majorly occurring in a downtrend that has a Bullish Engulfing Candle, cover the previous bearish candle's body entirely. The Bullish candle, occurrs in the downtrend, it shows an absolute reversal in the downtrend and leaves it close above the previous bearish candle.
The significance of this is heavy too, as it entails the buyers' control of the market.
We could further explain this, as a double candle reversal pattern where the next candle completely engulfs as the name implies, the body of the previous without consideration of the length of the former standings.
We could deduce thus, that in a very bearish situation, a Bullish Engulfing Candle stick pattern would be pointing at a highly volatile bullish market situation.
Finally, we see the psychology behind the Bullish Engulfing as :
The market forming red candles, lower positions a day before the Bullish Engulfing Candle forms and the next day, the stock prices open close to former day closing price and moves to form a new low. They want to buy due to previous bearish stands is available and the move to bring a higher market that the previous day is here and the market trend reverse is complete
The Doji Candlestick Pattern
It could be seen as another basic pattern of candlesticks on the chart.
Originally, the word Doji in Japanese means mistake and the Doji Candlestick Pattern explains indecision of the market movements in that market positions are opened and closed same moment, leaving the sticks without a fledged body like other candlesticks. Here, the dragon fly dogi represents the Bullish reversal in value and the Gravestone Doji represents a bearish reversal in value too.
Finally these candlesticks give the notion of Noone having the ability to influence the market and the best advise would always be to hold on for another candle to form before trade decisions are made.
We see its psychology as the traders having to wait during the Doji forming for the next Candlestick to form to be able to act /decide next trade movements.
The Hammer Candlestick Pattern :
The psychology of the Hammer Candlestick is seen as trades lose recognizable value than their openings but keep moving to attain the original opening price at least.
The long shadow /wick showing market rejection and movement of prices is more so twice the size of the main bar in the candle stick.The inverted hammer on its own holds the reversal position and points at a major drop in the market.
We could imagine this in a situation where the Hammer Candlestick is present in a chart where price has moved through so low, and finally moves to form a little place close to the opening position and we all know we should expect a rise position and let's say someday after the rise situation we see the inverted Hammer Candlestick with a same high rise trend over the opening position and even seeking to get to the open position and everyone knows too that there is a relative fall next as traders are expected to sell off.
The morning and evening star pattern :
The psychology of the Morning and Evening Star Pattern is based on a three Candlestick movement involving one Bullish, a Doji and another bearish Candlestick or the other way round during either the morning or evening aspect of it
In the morning aspect, we see one bearish Candlestick at the beginning explaining that sellers have price control, up to a Doji level and then finally buyers get their hold of the market with the last bearish candle and the other way round with the evening aspect.
We also deduce that the morning star pattern forms a Bullish reversal pattern and the evening star pattern forms a Bearish Reversal Pattern
Identify these candlestick patterns listed in question one on any cryptocurrency pair chart and explain how price reacted after the formation. (Screenshot your own chart for this exercise)
Bullish Engulfing Candle Stick Pattern
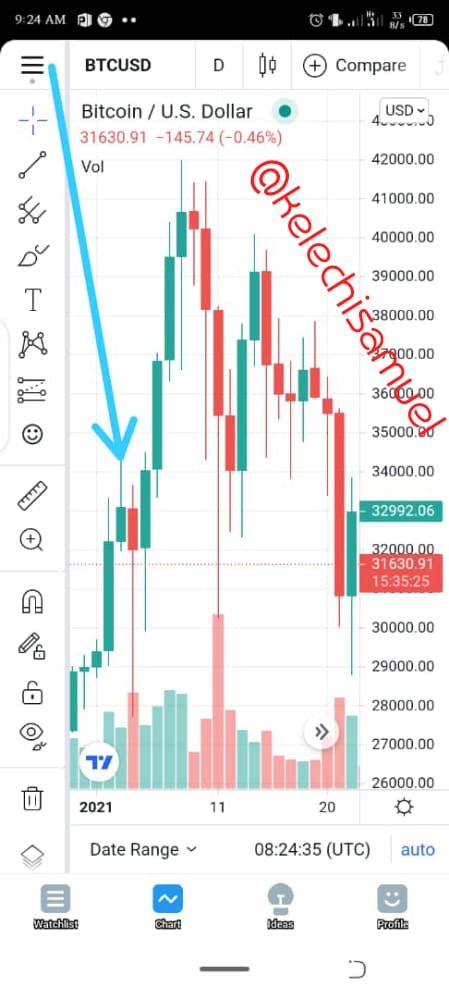
The chart above shows a Bullish Engulfing Candle stick pattern in a bitcoin graph clearly showing the Bullish candle engulf the previous bearish candle.
The resultant effect could be seen as the prices keep up with the Bullish trends even higher continously to a point where the volatility has its re-effect down
The Doge chart
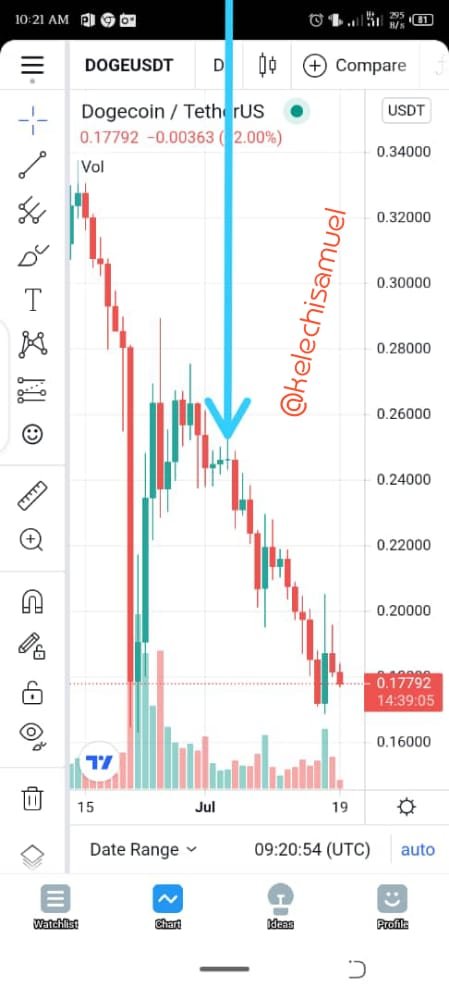
The doge chart here too shows the Doji candle stick pattern with a little bullish trends over the market and at the appearance of the Doji candle, the market goes falling.
This is one of the reasons why traders are told to keep indecisive patterns at the presence of the Doji Candlestick Pattern
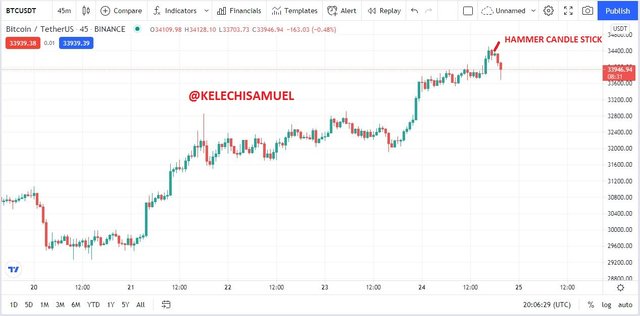
Hammer Candlestick
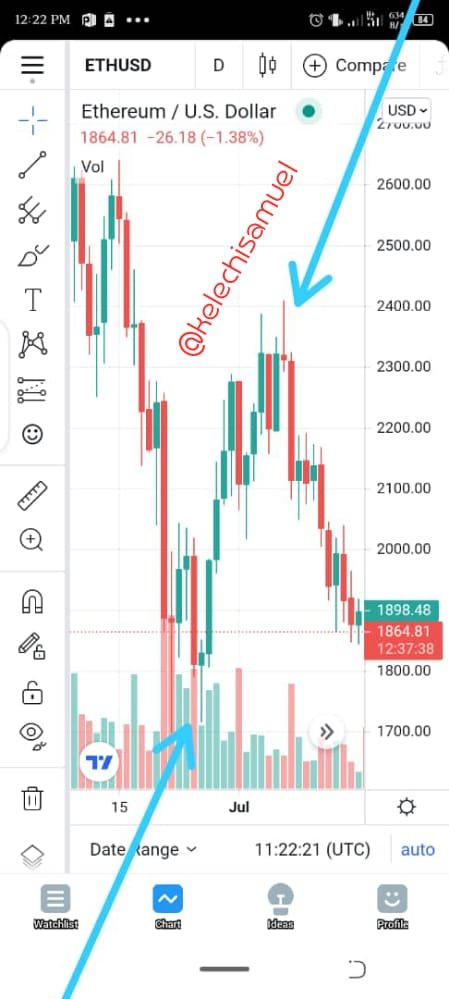
The Ethereum chart here shows a hammer candle stick Chart having two Candlestick hammers with their shadows going far below and above open and close positions respectively and the relative market movements following
For example, we see the shadow highs and lows and their responsive market movements after the shadow movements
Morning Star Candlestick
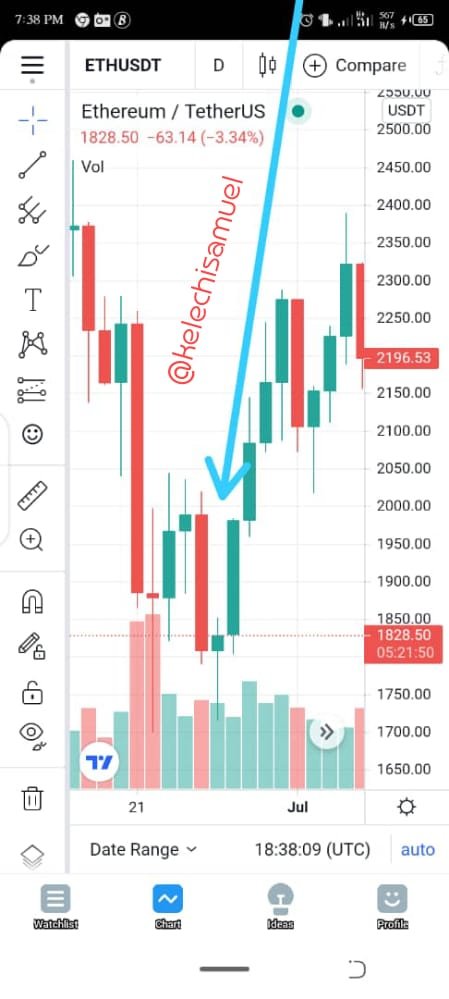
We see the morning star candlestick charts below as there is a bearish candle first stating the control of the market by sellers, then a Doji Candlestick after which the buyers regain the market and a Bullish trend moves up
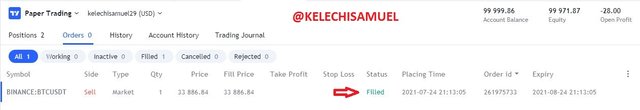
Using a demo account, open a trade using any of the Candlestick pattern on any cryptocurrency pair. You can use a lower timeframe for this exercise.(Screenshot your own chart for this exercise).
I opened the below position when I saw the signal of hammer candle stick pattern
In conclusion, the candle stick pattern is a very essential analytical tool to understudy and learn a lot from it and I am glad @reminiscence01 did a great job in the break down of this lecture
Thanks for reading my blog
Hello @kelechisamuel , I’m glad you participated in the 4th Week of the Beginner’s class at the Steemit Crypto Academy. Your grades in this task are as follows:
Observations:
It doesn't necessarily have to be the next day. It depends on the timeframe you are working with. Also, we are dealing with cryptocurrency and not the stock market. This is Steemit Crypto Academy.
Recommendation / Feedback:
You have done great work. Thank you for submitting your homework task.