LRI - Crypto Academy /S5W5-Homework Post for kouba01

Q.1. Discuss your understanding of the principle of linear regression and its use as a trading indicator and show how it is calculated?
Linear regression is a representation of data that plots a line that best fits selected dispersed points in the least square sense. This means it is a straight line drawn to ensure the minimum squared distance of points away from the line.
This line or linear representation does not necessarily touch all the points it represents, else it won't be straight. It however is drawn to ensure the sum of the squares of the distance of each point from the line is the minimum (i.e best fit line in the least square sense).
Consider the following illustration to aid a better comprehension of Linear Regression
Below we have a set of data points that intersect the y and x axis. These data points are not only numerous but also randomly placed.
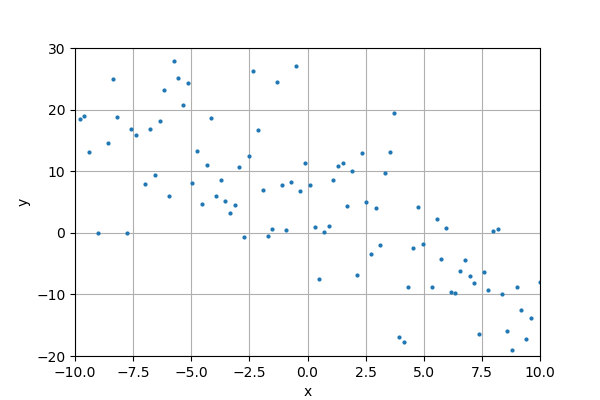
Credit
Representing these data points with a straight line model (i.e Y = wX + b) will give a clear visualization of the general direction of the given set of data. This however is impossible if all the data points are to be along the path of the straight line.
However, we can develop a straight line model that best represents these data points and which will plot a straight line that will be closest to these data points
Credit
For each of the data points, the difference between the data point and the corresponding point on the straight line is referred to as the error.
For the line to be closest to the data point it must have minimal error. To obtain minimal error for all the data points and still maintain the straight line model, we employ a line of best fit.
This could be done by Iterations (iter), which can be time consuming and usually requires computer operations.
Credit
CALCULATING LINEAR REGRESSION USING FORMULA
While iterations might be one way to find that line of best fit. Using formula is another way to go about it. The formula for calculating linear regression is given as
Y = wX + b + e
Where:
Y is the dependent variable
X is the independent variable
w is the slope
b is the Y-intercept
e is the error or residual
In regression analysis, when calculating by hand for linear regression, some key assumptions are made to reduce the need for iterations thereby fitting the analysis for calculations. These assumptions include:
The X and Y variables exhibit a linear relationship
The value of the residual e is normally distributed
The variance of the residual e is Homoscedastic - is same for all values of X
The value of the residual e is zero
With these assumptions, we can reduce the formula for linear regression to that of a straight line (since e = 0) which is
Y = wX + b
Where:
Y remains the dependent variable
X remains the independent variable
w remains the slope and
b remains the Y-intercept
Usually, X and Y is given and we're to deduce a model. The slope and the Y-intercept are given by the formula below
w = (ΣY)(ΣX2) - (ΣX)(ΣXY)/n(ΣX2) - (ΣX)2
b = (ΣXY) - (ΣX)(ΣY)/n(ΣX2) - (ΣX)2
This formula basically deals the summation of the independent variable and the dependent variable (i.e ΣX and ΣY), the number of data points available (i.e n), as well as the summation of their products (i.e ΣXY)
USING LINEAR REGRESSION AS A TRADING INDICATOR
Linear regression finds application in trading and is one of the numerous Trading Indicators available for Technical Analysis. How is it used as an indicator? One may ask. Simple.
First, for trading, X and Y is replaced with time and price respectively. Rather than plotting Y vs X, in trading, price is plotting against time. The price points could be any of the closing or opening price for the considered timeframe.
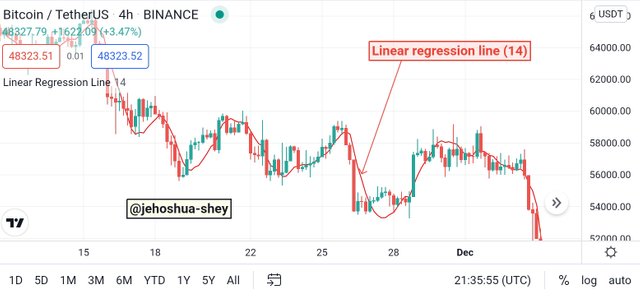
Just like many other indicators, the linear regression line indicator considers a number of candles for each data point in its plots. By default, the selected number of candles considered is 14. It might also be referred to as the standard number of candles considered.
Below is an example of the linear regression line indicator on a BTCUSDT 4h chart.
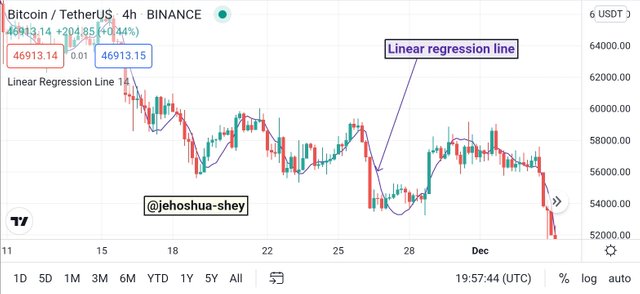
This indicator is similar in appearance to a moving average and very valuable in deducing very precise and effective signals.
Q.2. Show how to add the indicator to the graph, How to configure the linear regression indicator and is it advisable to change its default settings? (Screenshot required)
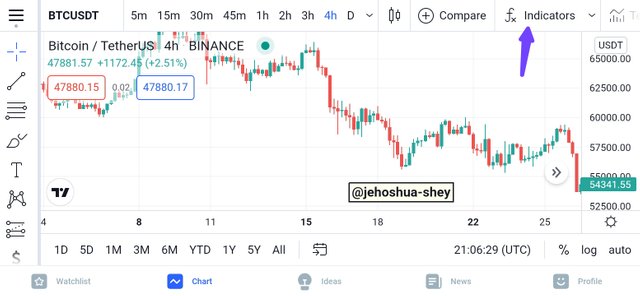
To add and configure the linear regression indicator to the graph, following the simple steps below using Tradingview.com.
First, sign up for a free account with them, then select a pair to open up the chart. On the chart window, click on indicator as shown below
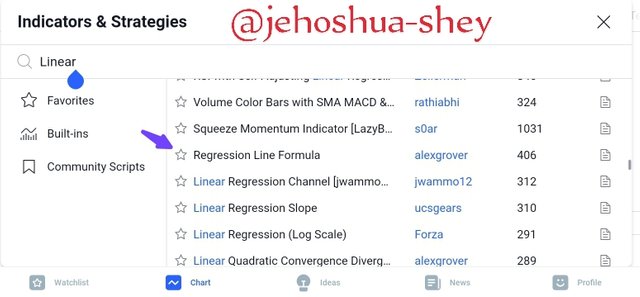
Next, type 'linear' in the search bar and scroll down to find 'Regression line formula' and select that option as shown in the image below.
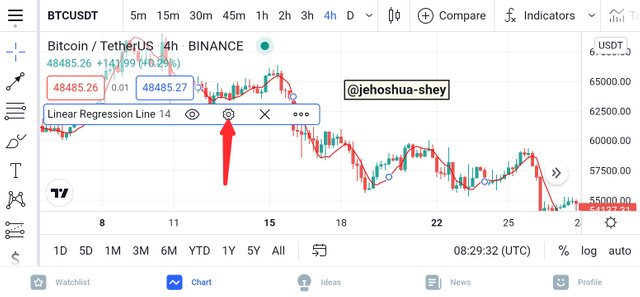
The indicator will appear on the chart. To configure the indicator, click on the settings icon like in the image below.
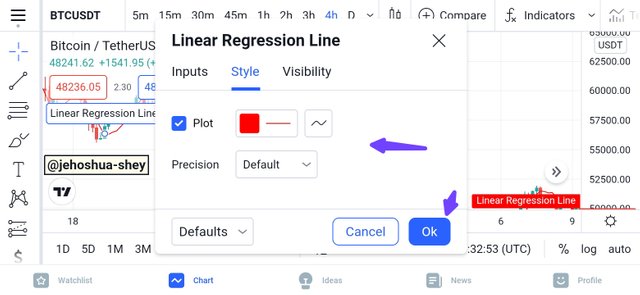
You can then configure the indicator, e.g selecting the line color and the precision in the style tab of the settings dialogue box as shown in the image below.
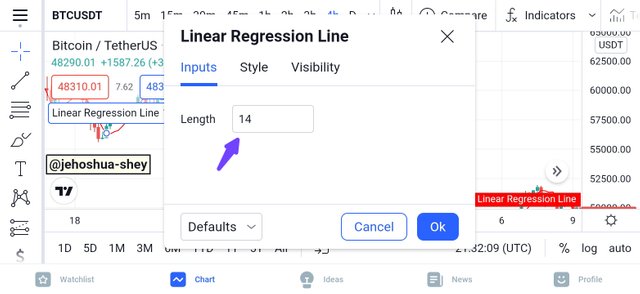
You can also configure the length and change it to a figure other than the default or standard 14 in the input tab of the settings dialogue box as shown below.
After that, you should see the indicator added to the chart and ready for use like in the image below.
SHOULD THE DEFAULT SETTINGS BE CHANGED?
The settings used totally depends on the choice of the trader. It is advised that for a trader who is a beginner with insufficient experience, the default settings should be used as is. However, if a trader has advanced with substantial experience and wishes to alter the settings especially for the length, then they can so do.
For instance, a trader might find the period of 66 better suited to their trading style and more productive for them. They can so change if they please. Any period between 3 and 300 should serve for most trading patterns.
A good trader should always observe the benefits or consequences of decisions they take so as to optimize their trading activities and that includes look-back periods like the length of the linear regression line indicator.
Q.3. How does this indicator allow us to highlight the direction of a trend and identify any signs of a change in the trend itself? (Screenshot required)
When using the linear regression line indicator, the direction of the trend is shown by the direction of the linear regression line. The slope of this line however changes as price changes.
So as long as the linear regression line keeps going in a single direction, it confirms the price trend in that direction.
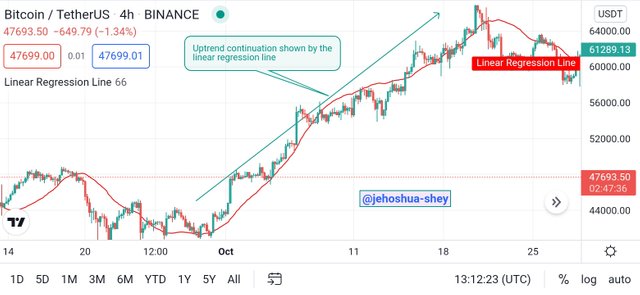
Linear regression line indicator showing the direction of uptrend
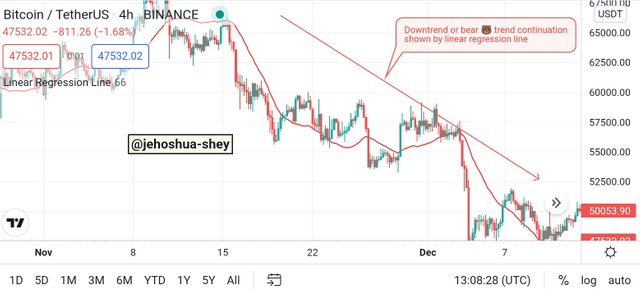
Linear regression line indicator showing the direction of downtrend
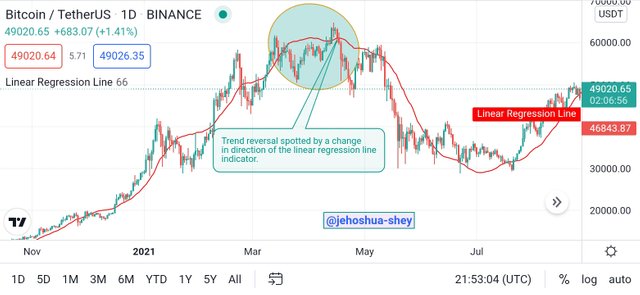
SPOTTING TREND REVERSAL WITH THE LINEAR REGRESSION LINE INDICATOR
Trend reversals can be identified by a change in the linear regression line indicator from uptrend to downtrend. When there's a cut, it confirms the trend reversal.
Thus, if there's a change in direction of the linear regression line indicator from uptrend to downtrend or vice-varsa, irrespective of where the price is, it is an indication of a trend reversal. If there is a cut (i.e price crossing the linear regression line indicator), then the trend reversal signal is even stronger.
Q.4. Based on the use of price crossing strategy with the indicator, how can one predict whether the trend will be bullish or bearish (screenshot required)
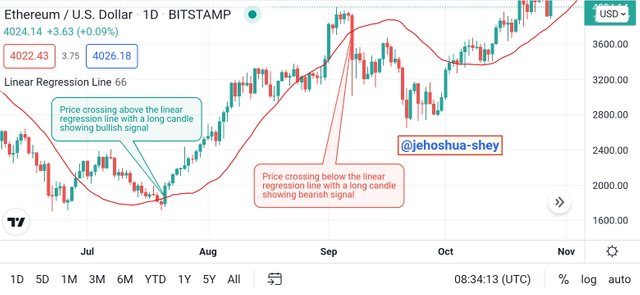
One important signal that can be read when using the linear regression line indicator is a 'cut'. This occurs when the price crosses the linear regression line. This signal is involved in the crossing strategy used to decipher bullish and bearish trends.
In deciphering bullish trend, the price has to cut above the linear regression line (i.e crossing from below to above) with a long price candle which must also close above the linear regression line. Here, the highest and lowest price points of the candle simply do not matter.
In deciphering bearish trend, the price has to cut below the linear regression line (i.e crossing from above to below) with a long price candle which must also close below the linear regression line. Here, the highest and lowest price points of the candle also simply do not matter.
Q.5. Explain how the moving average indicator helps strengthen the signals determined by the linear regression indicator. (screenshot required)
Moving average indicator is very similar to the linear regression line indicator especially in the manner which trend signals are read. Just like the linear regression line indicator, price crosses or cuts are key signals for trend reversals under the same conditions of long candles and higher or lower closing prices depending on if it's a bullish or bearish trend respectively.
The two indicators can also be combined to give more strength to the signal. They can be used together to confirm or enhance the strength of a signal. This is even better when they are used across different time periods.
Below is a confirmation using moving average for a 1D ETHUSD chart. This shows how linear regression line indicator can be combined with the moving average indicator for the same period. The length for both indicators are same - 66.
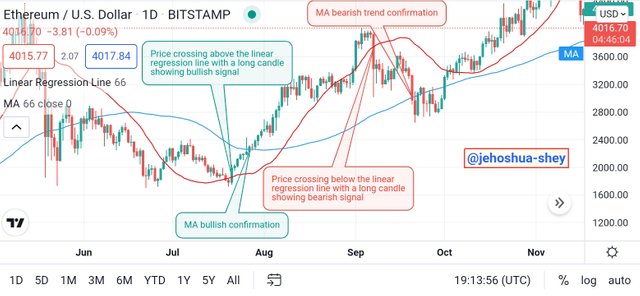
Linear regression line indicator - red,
Moving Average indicator - blue
Here, we see that the price cross occurs for the linear regression line indicator first, then it occurs for the moving average indicator. For the bullish cut, the signal proceeded rather convincingly. Though for the bearish cut it also proceeded but not for long.
Let's consider the same instance with different time frames and see the outcome.
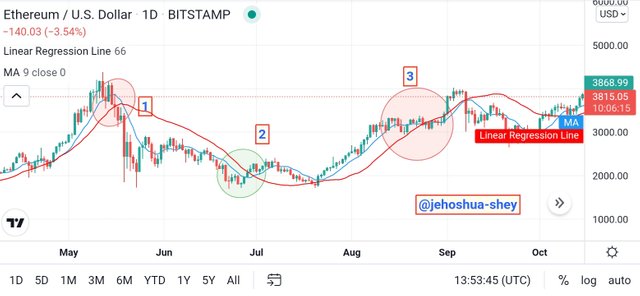
Above is a combination of a 9 period MA and a 66 period LRI. From the first circled area, we see a bearish cut first on the MA, then a bearish cut on the LRI, then finally a bearish crossover of the MA over the LRI. The result is a convincing bearish run down to point 2.
At point two, the same occurs for a bull run. First a bullish price cut on the MA, then a bullish cut on the LRI, followed by a bullish crossover of the MA over the LRI. The result is a convincing bull run upto point 3.
At point 3, the incidence at point repeats itself.
From the two illustrations involving same and different periods, it can be seen that both cases give confirmations but using different periods gives earlier and more concrete signals and confirmations.
Q.6. Do you see the effectiveness of using the linear regression indicator in the style of CFD trading? Show the main differences between this indicator and the TSF indicator (screenshot required)
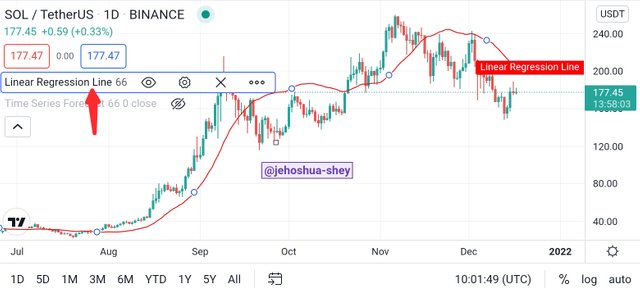
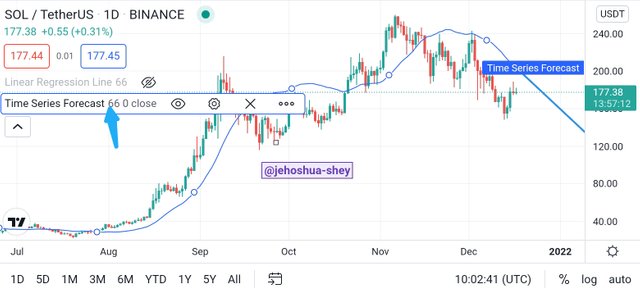
The Time Series Forecast indicator is a very competent tool for technical analysis in Contract for Difference (CFD) trading. This indicator is a trend following indicator that seeks to predict future prices in the short term using multiple linear regression models.
One characteristic that has enable the Time Series Forecast indicator to be effective is the fact that its data points follow a linear logic. The slope is added to the latest linear regression value to guarantee a high level of sensitivity to short-term changes unlike linear regression.
Thus the main difference between Time Series Forecast indicator and Linear Regression indicator is the period each is best suited for.
| Time Series Forecast | Linear Regression |
|---|---|
| Best suited for short term | Best suited for medium to long term |
These two indicators are compared below.
THE EFFECTIVENESS OF USING THE LINEAR REGRESSION INDICATOR IN CFD TRADING
Considering the utilities and applications of the linear regression indicator which can be used for spotting trend continuations and reversals and can be applied across a variety of time frames with different lengths, I'd reckon that linear regression indicator is effective for contract for difference trading as it can be used to identify a trend continuation and/or a trend breakout.
Price cuts on the indicator can also give valuable insights as to market entry and exits points. However, this indicator, just like most indicators, is better used in combination with another indicator for confirmation. One suitable indicator to combine with the linear regression indicator is the moving average.
Q.7. List the advantages and disadvantages of the linear regression indicator:
| Advantages | Disadvantages |
|---|---|
| LRI does not lag so much from the price unlike moving averages. This is because it is the best fit line to the price point, keep it closes to the price point as possible in the least square sense. | It's closeness to price means that it is not suited to very turbulent price changes. An indicator with more distances could dampen the turbulence in such cases. |
| LRI is very sensitive to changes in price direction. This can be credited to its closeness to the actual price points. | Because of its sensitive price changes, it can't give a broader view of price direction. Hence, it mustn't be used alone. |
| It easily recovers in any case of significant deviation and this ensures that it is very fast when it comes to updating the user on the latest price direction. | Because it updates the user very quickly, this indicator is prone to giving false signals, hence so many price cuts without convincing price runs. |
CONCLUSION
The LRI in an indicator that follows the linear regression model. It plots a line of points closets to the corresponding price points in the least square sense.
The LRI is a very potent indicator especially in combination with some other indicators like moving average. When combined with moving average across different periods (e.g MA 9, LRI 66), it tells to an impressive degree of accuracy, a trend reversal. This helps in CFD trading.
The LRI plots very close to price points, making it very sensitive to changes in price direction. This means that it can't also filter out violent price changes and market manipulations. Thus it becomes imperative to use the LRI in conjunction with other indicators like the MACD, RSI, etc.
Thanks for reading.
Cc:
@kouba01
Hello