Introduction to the Principles of Crypto Analysis - Crypto Academy S4W7 - Homework Post for @imagen


Q.1. What are the differences between Fundamental Analysis and Technical Analysis? Which one is used most often?
Fundamental Analysis:
Fundamental analysis involves understudying an asset to ascertain it's legitimacy and value. It is a recommended analysis for any crypto investment as it helps to avoid scams and to identify assets with intrinsic value and future prospect.
In the process of this understudy, lots of factors are considered including the asset's origin, the asset's utility, the asset's community, the asset's popularity, the asset's tokenomics, the asset's current market value, onchain analysis of the asset, etc. All this are done to ascertain if the asset is legit and what the value of the asset is.
Technical Analysis:
Technical analysis involves the study of charts to analyze price history and predict future price movements. It can be used to decipher short and long term price movement with the aid of technical indicators to a good degree of accuracy. It comes highly recommended especially when it's augmented with fundamental analysis.
DIFFERENCES BETWEEN FUNDAMENTAL ANALYSIS AND TECHNICAL ANALYSIS
Below are the key differences between fundamental analysis and technical analysis
| Fundamental Analysis | Technical Analysis |
|---|---|
| Evaluates an asset future price by its value | Evaluates an assets future price using price charts |
| Studies factors that can affect prices | Studies prices |
| Is used by investors | Is used by traders |
| Can over valuable insight into the long term value of an asset | Can offer valuable insight into the market entry and exit points that will ensure optimal profit |
| Usually gathers data from news, events, relevant statistics, etc. | Usually gathers data from charts |
| Traders who use this are envisaging long term | Traders who use this are envisaging short term |
Q.2. Choose one of the following crypto assets and perform a Fundamental Analysis indicating the objective of the Project, Financial Metrics and On-Chain Metrics. (Asset Chosen: Polkadot)

Image Credit
Polkadot is a blockchain protocol that enables different blockchain protocols to combine to form a single network. It helps to consider it as an operating system upon which different blockchains can run on. This blockchains that will run on Polkadot will be referred to as layer-1 blockchains. Thus, Polkadot itself is referred to as a layer-0 blockchain protocol.
OBJECTIVE OF THE PROJECT
The Polkadot blockchain protocol was created to ensure decentralization on the internet. One common thing obtainable today on the web space is centralized organization having possession and control over user's information.
Polkadot was created to address this by giving the users back the control and possession of their data through laying a foundation for a sophisticated ecosystem of blockchains enabled with cross-chain interaction which will allow for creation of different blockchains with different applications.
FINANCIAL METRICS
DOT has circulating supply of 987,579,314.96 DOT with a unit price of $43.9. This means it has a market cap of $43,350,348,219 making it the 8th most valuable crypto asset.
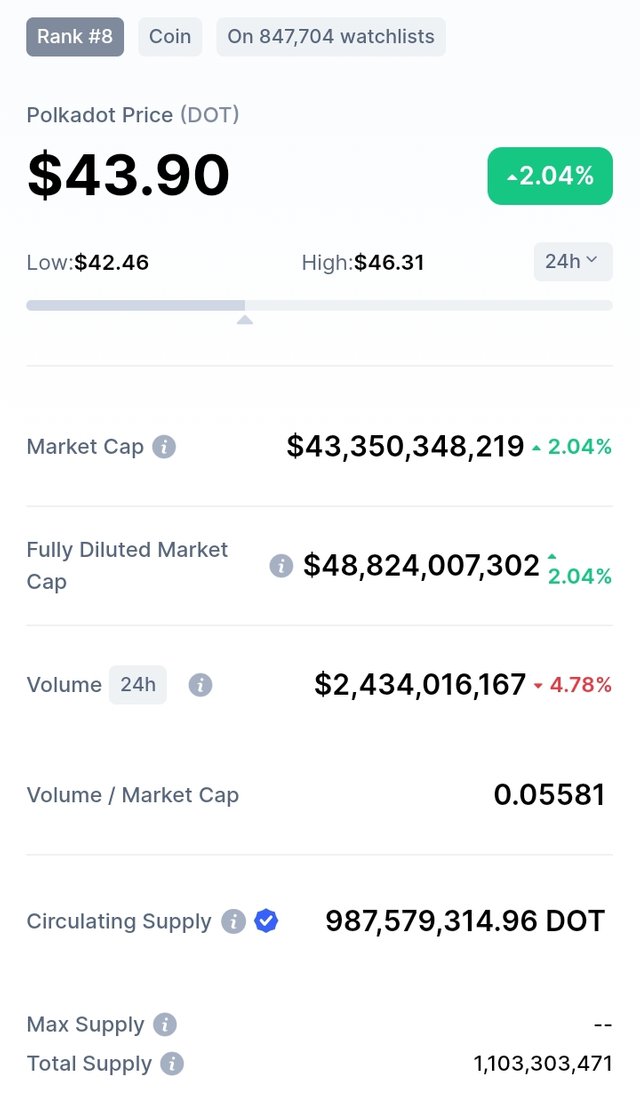
Image Credit
DOT's total supply is given as 1,103,303,471 meaning some of it is out of circulation. The maximum supply is not yet fixed and so, there could still be more DOT in the future.
At it's first sale, DOT was valued at $0.29 which means those early buyers would be locking in over 150x profits from owning the token earlier. The token is has the highest value per unit of all tokens with more than 500M units in circulation. This implies, despite it's abundant circulation, the token still has staggering value.
It has the potential to double it's current market cap due to it's utility on the Polkadot blockchain protocol as it is used for governance, onchain operations and chain bonding.
ONCHAIN METRICS
From the CoinmarketCap screenshot above, the token boast of a daily trade volume of $2,434,016,167 across multiple exchanges. This is a sign of high trade activity and liquidity on the token. This also implies a large volume of DOT available for trade in exchanges.
Q.3. Make a purchase from your verified account of at least 10 USD of the currency selected in the previous point. Describe the process. (Show Screenshots).
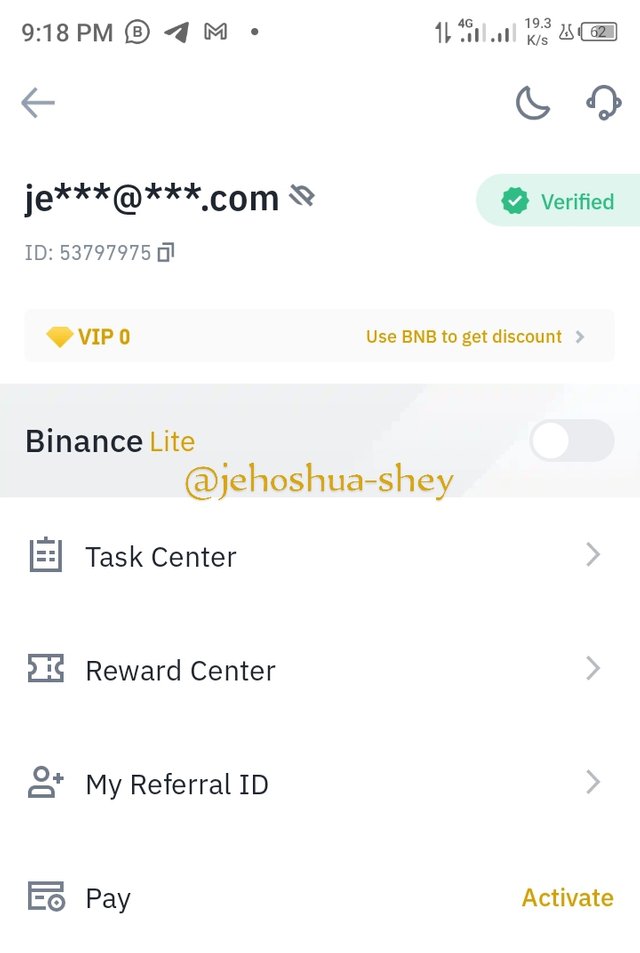
Here's a proof of my Verified account on Binance.
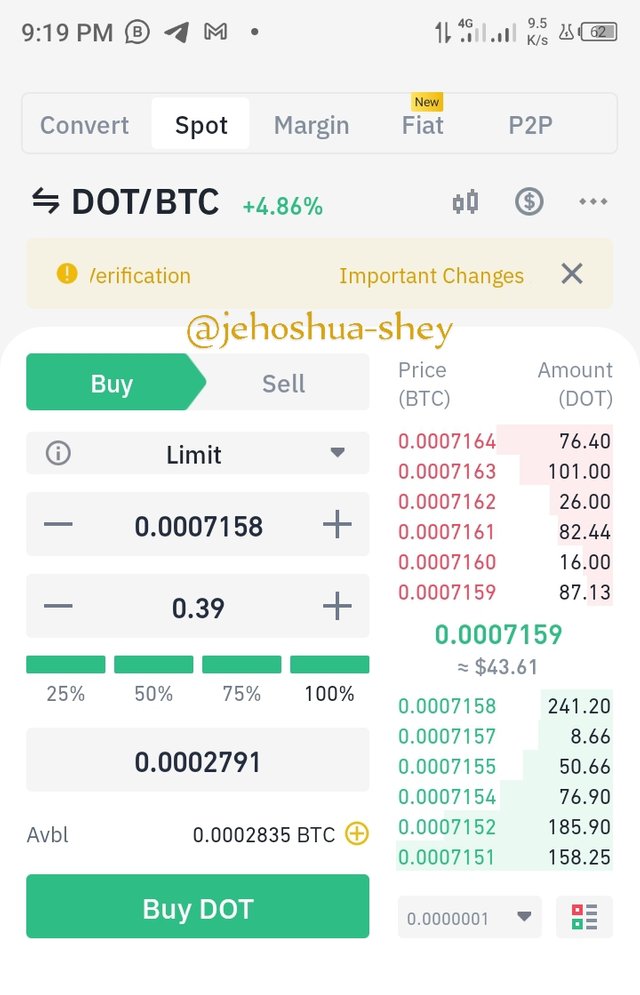
On Binance, I search for the DOT/BTC pair and select buy as I have some BTC worth about $17. Next, I set my price and place my order for 0.39 DOT
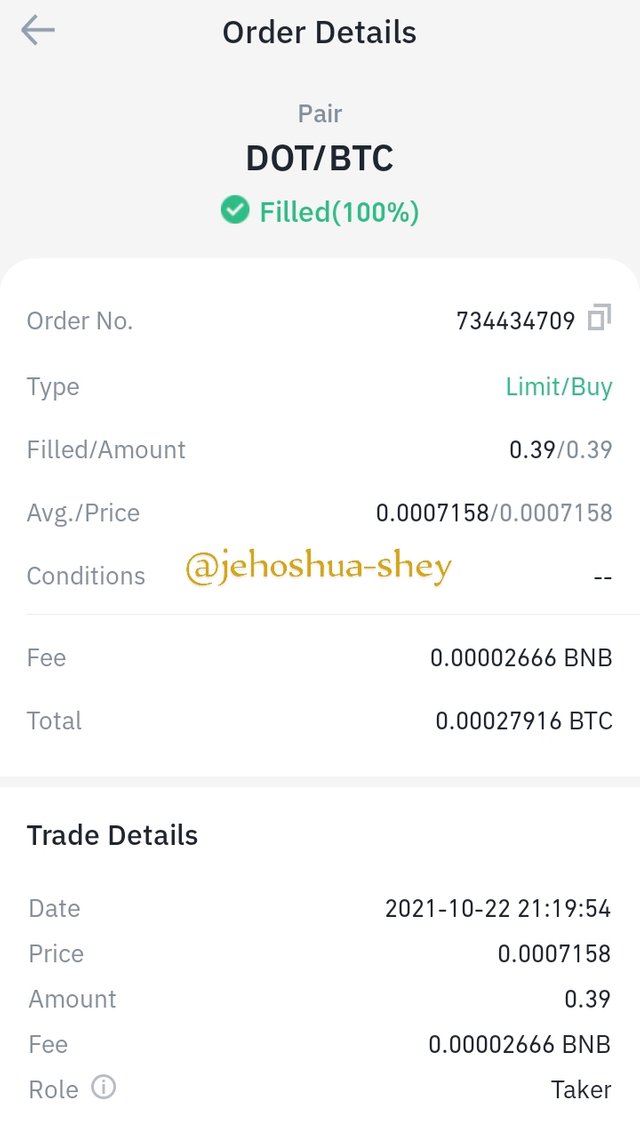
The order was executed almost immediately. Here's proof of the trade.
Q.4. Apply Fibonacci retracements to the previously selected asset with a 4 hour time frame on the platform of your choice. Observe the evolution of the price at 24 and 48 hours, did it go up or down in value? Look to identify resistance and support levels. (Show Screenshots at 0, 24 and 48 hours of purchase where the date and time are observed).
Below, I applied Fibonacci Retracements to the DOT/BTC 4hr chart via Tradingview. This is the first hour after purchase, so, have to take another screenshot after 24 hours.
Hour 0
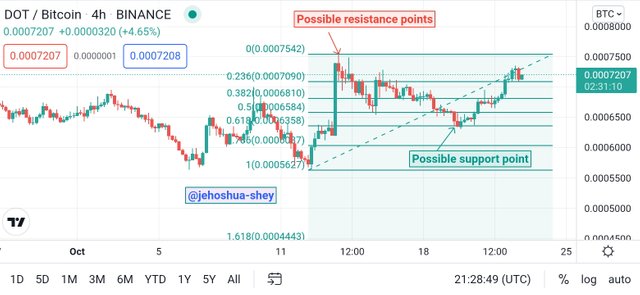
I identified possible support points at the 0.618 ratio/line and resistance points at the 0 ratio/line.
Q.5. What are Bollinger Bands? How do they apply to Crypto Technical Analysis? With which other tool or indicator do you combine Bollinger Bands to analyze a Crypto? Justify your answer.
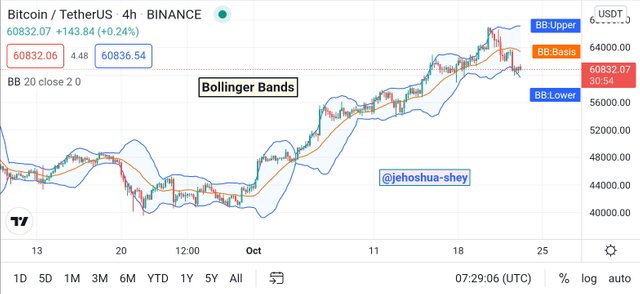
Bollinger Bands are oscillator indicators that shows the volatility of the market as well as the overbought and oversold conditions in the market. They measure price deviation from an average value.
BOLLINGER BANDS
Bollinger Bands indicates the volatility of the market and through this, the trader can ascertain the amount of profits to be gotten from the market . They can also ascertain the trend of a market, if it's upward, downward or sideways.
Bollinger Bands basically shows how price diverge away from or converge towards a center value. This is why it is made up of 3 bands, namely the upper band, the lower band and the middle band.
HOW BOLLINGER BANDS APPLY TO CRYPTO TECHNICAL ANALYSIS
The middle band is a 20-day SMA(Simple Moving Average) while the upper and lower bands are a measure of standard deviation with the SMA as the average value. The upper and lower bands tells the volatility of the market when they are both observed against the middle band or 20-day SMA.
The upper and lower bands converge towards the middle band when the volatility is low and diverge away from the middle band when the volatility is high. It is important to note that Bollinger Bands are not suitable for identifying buying and selling opportunities. It can however, show if the market is overbought or over sold through the following observations:
If the Price is above the middle band (SMA line) and goes above the upper band, then the price is overbought
If the price is below the middle band (SMA line) and goes below the lower band, then the price is oversold.
In a case where the price touches the upper band more than once, it suggests a resistance level.
In a case where the price touches the lower band more than once, it suggests a support level
INDICATOR TO BE COMBINED WITH THE BOLLINGER BANDS
Relative Strength Index (RSI)
One indicator I would prefer to combine with the Bollinger Bands indicator is the Relative Strength Index (RSI) indicator. This indicator also tells of overbought and oversold proces and as an addition tells when the price is bullish or bearish. It's shows divergences which can be very useful.
RSI divergences can show when a trend is about to reverse especially in the overbought or oversold conditions. RSI should ideally confirm the Bollinger Bands overbought or oversold conditions first, then RSI can be checked for divergences.
If divergences are found in any of the overbought or oversold conditions, the market structure break strategy can be applied to pick out optimal entry and exit points.
CONCLUSION
Fundamental analysis plays a key role in deciding which asset to invest in. It helps to identify scams and valuable assets. Sometimes, after this assets have been identity, they may be traded by the investor who might want to make some frequent entry and exit. At these points, they'll need technical analysis.
Technical analysis is the study of charts to determine trends and future prices. It is done using tools and strategy. It is most efficient when these are combined. Of the numerous tools available, a good combination is the RSI and the Bollinger Bands. They can also be augmented with some strategy depending on the market structure or price trend.
Thanks for reading.
Cc:
@imagen
PS: This post will be updated as a result of the question 4. Which is time bound.
Gracias por participar en la Cuarta Temporada de la Steemit Crypto Academy.
Continua esforzandote, espero seguir corrigiendo tus asignaciones.