Crypto Academy Week 14 - Homework Post for @fendit
INTRODUCTION

In crypto trading, tools and techniques are indispensable. Employing them draws the trader closer to accurate predictions and minimizes the chances of huge losses. They show the trader when to make an entry into the market and also, when to make their exit. With their guidance, a trade can secure more profit and record minimal losses.
It is important for a crypto trader to have an elaborate repertoire of these tools and techniques which includes but is not limited to, support, resistance, moving averages, supertrend, RSI, finger-trap, Elliott's wave theory, etc.
This post expatiates on one of these tools - the Elliott's wave theory. The post is also my homework task entry for this crypto academy week 14 course
ELLIOTT's WAVE THEORY
In the seemingly random price actions of the very volatile crypto market, there is actually a pattern that can be used to predict near accurately, the future direction of prices of crypto assets.
This is according to one accounting nerd who studied 75 years of market data named Ralph Nelson Elliott. He came up with a wave theory and since it was his idea, he hosted the naming ceremony.
Elliott's wave theory tells us that price movement from point to point, follows a wave pattern that can be used to predict the future prices. This waves can be attributed to the constant switch from optimism to pessimism and from full confidence to little or no confidence, all in the minds of the market traders and within a short period of time.
APPLICATION OF ELLIOTT's WAVE THEORY
If you're conversant with scientific transitions from theories to laws, you might have raised an eye brow upon realizing that Elliott's conclusion on price patterns is still in theory.
Well, the truth is that, though Elliott's wave theory is not at all perfect, especially when traded in isolation, it supplies an impressive buoyancy aid for treading the volatile waters of the crypto market.
This theory has two main applications. They are:
ENTRY AND EXIT GUIDANCE
Understanding and correctly applying this theory gives the the trader invaluable guidance on when to open a position and when to close it especially when it is traded along side other technical tools that work well for the trader.
SETTING STOPLOSS
Again, if the trader can correctly identify the wave patterns, they can offer impressive suggestions on stoploss. It is worthy of note that stoploss is an all-important when entering any market.
In applying this theory, note the following when searching for the wave patterns.
Wave 1 ≥ Wave 2
Wave 1 > Wave 4
Wave 3 is the longest of all waves
ELLIOTT's WAVE THEORY's PATTERNS
In Elliott's wave theory, there are two distinct patterns to look out for. It can be very difficult to spot but if you do, you might have as well found an invaluable guide for making sensitive market decisions like entry, exit, and stoploss.
From Elliott's theory, waves form cycles called market cycles. Each of these cycles consist of 8 waves which includes both wave patterns.
Here are the two patterns to look out for
IMPULSE WAVES
This is the first 5 waves in a market cycle and are usually numbered 1 - 5. These waves emanate from traders/investors, going with the market trend. They show huge variations in prices. The biggest price variation in the cycle is an impulse wave (wave 3).
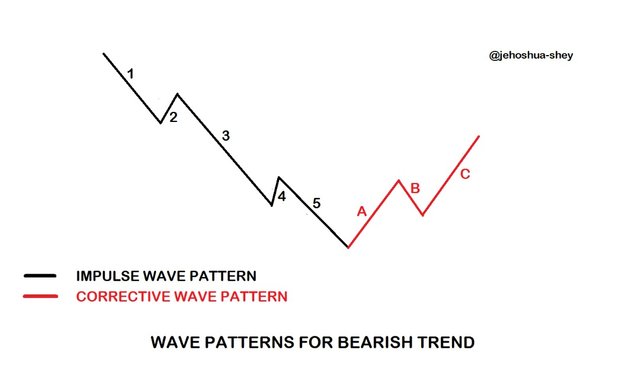
Fig. 1a
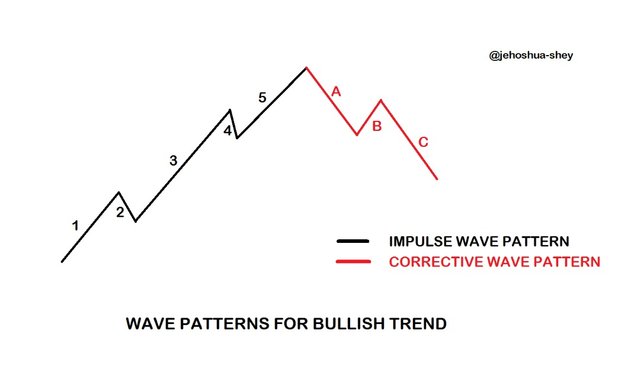
Fig. 1b
Consider Fig. 1b,
Wave 1 begins the bullish trend. There, investors buy at relatively low prices.
At wave 2, there's a drop in price. Some investors who bought earlier have begin to square off their positions for profits. The price however, doesn't drop to the initial price of wave 1.
At wave 3, more investors are increasingly confident of the prospect of the asset and they rush to buy en masse. This makes the price to skyrocket. This wave is the longest.
At wave 4, some of those wave 3 traders might act like some wave 1 traders and begin to close their positions to make profits. Confidence or optimism about the coin is gradually diminishing in the minds of these investors. Te price drops again, as in wave 2.
Profit making is an attractive exercise, isn't it? Well, some investors think so, and they join the trend at wave 5. By then, lots of people (wave 2 & 4 investors) have made profits. Unfortunately for wave 5 traders, the price of the asset at that point is in the overbought zone.
CORRECTIVE WAVE PATTERN
Elliott also found out that the market usually corrected itself, whether it is bullish or bearish. From this market behavior, he came up with the second wave pattern. The corrective wave pattern goes against the market trend and it's usually lettered a - c. Check Fig. 1.
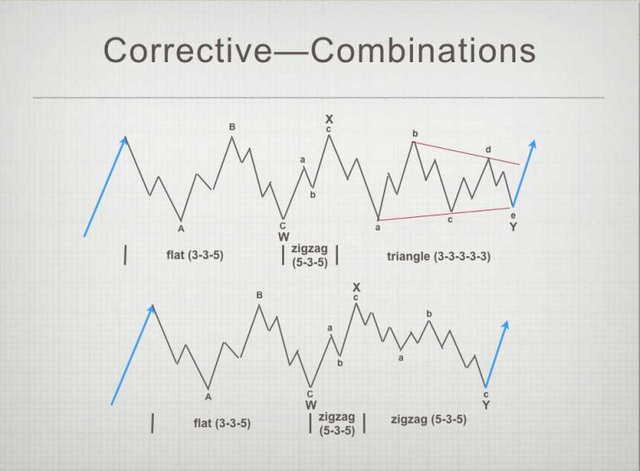
Spotting the corrective wave pattern is not quite simple but is very possible. Wave B goes in the opposite direction (in the direction of market trend) to waves A and C. Also, the three waves have 3 chart formations,
Zig-zag: This forms when wave B is shorter than waves A and C.
Flat: This forms when all the corrective waves are of the same length.
Triangle: This formation shows a reduction in volatility. It is not necessarily about the length of each wave but about the gradual reduction in the price range. In Triangle formation,
Wave A > Wave B > Wave C.
MY THOUGHTS ON ELLIOTT's WAVE THEORY
Here's my personal opinion on Elliott's wave theory:
Firstly, though it's not in anyway perfect, it can give remarkable insight into the market, hinting on future price directions.
Also, if the trader decides to trade the Elliott's wave theory with other technical indicators that work for them (like for instance RSI + Support + Resistance + Supertrend works for me), it will be more accurate and profitable.
That said, the challenges of Elliott's wave theory can't be ignored. It is very difficult to spot. It so difficult to spot the waves that sometimes, when some traders apply the theory and it goes against them, rather than blaming the theory, they blame their inability to spot the waves. For me though, that's just semantics.
The difficulty in spotting these waves is as a result of the ambiguity of the theory which ought to be so. A technical tool should be clear enough to the trader using them.
For me, this difficulty is a failure of the theory to support smooth technical application but for many other users of this theory, they'll defend the theory.
Finally, I usually don't use this theory except I'm clearly sure that I discovered the wave patterns correctly and if I must use this theory, I must use it together with other technical indicators like support, resistance, RSI, MACD, and supertrend that works fine for me.
AN INSTANCE OF ELLIOTT's WAVE THEORY ON A 1D STEEM/USDT
Let's give a practical instance of the Elliott's wave theory using a STEEM/USDT 1-day chart.
The chart runs between the periods of Mar 22 - Apr 14, 2021.
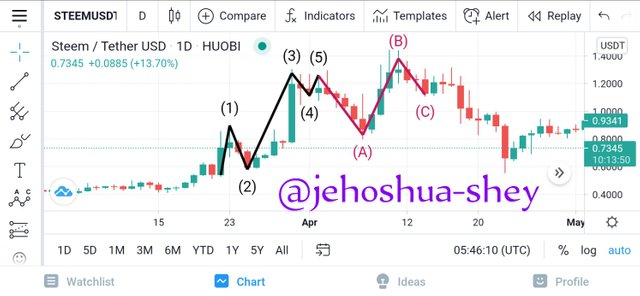
Fig. 2
From the chart above, we see a bullish trend with all 8 waves, indicating that a complete market cycle was formed.
The price begins to rise on Mar 22, then investors were buying at relatively lower prices. This rise ends the next day, on Mar 23. By Mar 24, some of those investors who bought earlier at lower prices, have begun closing their positions to secure their profits. This leads to a drop in price.
The price drop continues till Mar 25. Then, investors are no longer willing to sell and more investors are willing to buy. This leads to the largest price variation in prices during this market cycle - wave 3.
Prices skyrockets for days especially on Mar 30. At this time, some investors want to close their positions and secure their profit again and so the price drops for two days again. On Apr 2, more investors come in to buy and the price pumps a little.
By Apr 3, immediately after the 5th impulse wave, the market begins to correct it self. Here, you can say that the confidence in the coin begins to diminish. Investors think the price won't appreciate further because it is overpriced. It is this change in psychology from full confidence to little confidence that orchestrates the market correction.
So, prices drop for days (wave A), just as it rose, until Apr 7. Then it seems like the market over corrected itself, as prices begin to push back up for the next 4 days. However, this push (wave B) is not as enormous as that of wave 3.
Because the market correction is still on, prices slump again on Apr 12 through to Apr 14. This is the 8th wave (wave C) and it completes the market cycle.
Looking at the corrective wave pattern ABC, we notice that B is the longest and C is the shortest. It's difficult to place what kind of corrective pattern this is, according to Elliott's wave theory.
But let's check, is our wave market cycle selection correct?
✅ Wave 1 ≥ Wave 2
✅ Wave 1 > Wave 4
✅ Wave 3 is the longest
Also
✅ Waves A, B, & C comes immediately after Waves 1, 2, 3, 4, & 5
However, it's only our corrective wave pattern that we can't seem to categorize. I think this doesn't negate our selection as we checked all the essential cycle characteristics.
CONCLUSION
I've been able to talk about and show how the Elliott's wave theory is applied and what I think about it. I have to reiterate that it is better not to use the theory in isolation, at least, it's still a theory for the past 80-something years.
Trading the Elliott's wave theory alongside other technical indicators that work for you is strongly advised as the difficulty in ascertaining the correct wave cycles remains a major pitfall of the theory.
The theory however, when correctly applied can give an invaluable insight into the price movement in the market, thereby guiding price predictions to an impressive degree of accuracy.
For me, the best time to enter the market using the Elliott's wave theory is
- Wave 1 - Wave 2, to exit at Wave 5
Thanks for reading.
Cc:
@fendit
Thank you for being part of my lecture and completing the task!
My comments:
Loved your work!!
Everything was really, really good!
I think you've completelly succeded in this class, you were so into details and so precise when explaining that it was a pleasure for me to go through your work.
Congrats on such good work :)
Overall score:
9/10
Wow! Thank you so much professor @fendit. I'm glad you enjoyed reading my blog.