Crypto Academy Week 16- Homework Post for [Professor @stream4u] |Technical Indicators - Pivot Points| by @huzaifanaveed
Hello everyone. A warm greeting to professor @stream4u and everyone reading this.
This is my assignment post.
Lets get started
This season of the academy was basically about all the indicators. We learned about various Technical indicators such as the RSI, MACD, BOLLINGER BANDS and now PIVOT POINTS
lets have an in-depth analysis of the Pivot point
Pivot point is a technical indicator, formulated by Mr Manning stoller in the 1980s, which helps us pick-out the whole market trend over different time frames.
The pivot point uses the intraday highs and lows which are the previous days highs and lows and the closing prices of the previous day, through which the pivot point can be calculated.
There are basically three points.
a) The main point known as the Pivot point.
b) the points above the Main pivot point known as the resistance levels
c) the points below the pivot point known as the support levels
lets do an in-depth discussion about the pivot point levels.

2
PIVOT POINT LEVELS
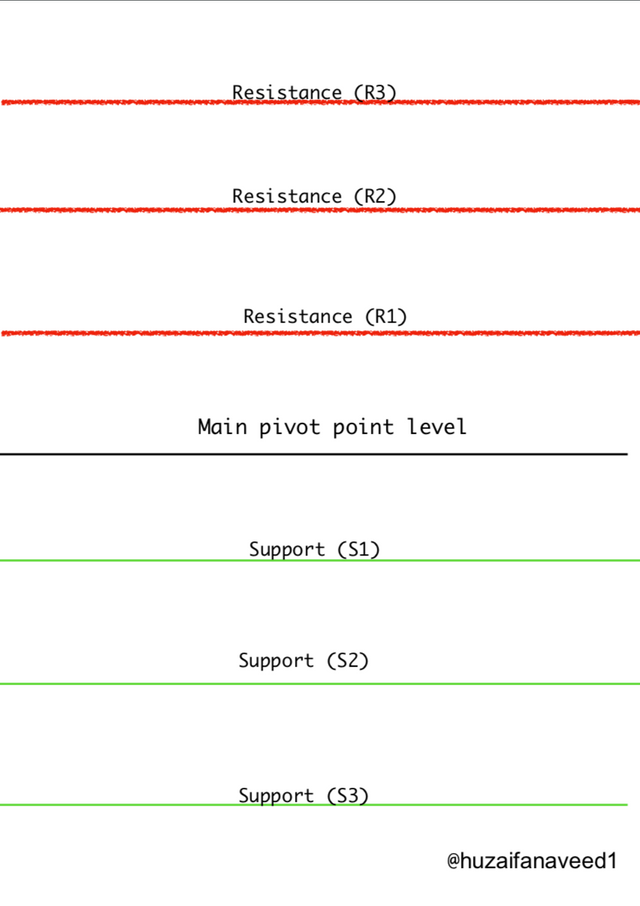
Pivot point indicators has a main pivot point level with 5 resistance levels above it and 5 support levels below the main point level
- MAIN Pivot point level: This is the main pivot point level in the centre.
If the market is above this level then it is a bull market which means you can sell of your assets to get good profits. If the market is below this main level then it means that this is a bear market and you can wisely invest in some assets of your choice.
- RESISTANCE (R1): This level indicates an overbought situation, a start of the bull market. Now here are two directions the market could do. Either it could turn into a reverse trend and go downwards or it could go upwards and breakout in a bull market.
- RESISTANCE (R2): This is the second resistance level above the R1. If the market has reached upto R2 it indicates a bull market trend. From here the trend could go upwards or pull back downwards.
- RESISTANCE (R3): This is the third and last resistance level above the pivot point. This level indicates an overbought condition. From here the market could pullback or move further up towards a bull trend.
- SUPPORT (S1): This is the first level below the main pivot point. This level indicates an oversold condition. This is the start of the bear trend. From here the price could bounce back into a reverse trend or could break the support level and continue further into the bear market.
- SUPPORT (S2): This is the second level below the main pivot point. This level indicates an oversold condition. From here the price could bounce back into a reverse trend or could break the support level and continue further into the bear market.
- SUPPORT (S3): This is the third level below the main pivot point. From here the price could bounce back into a reverse trend or could break the support level and continue further into the bear market. This indicates an oversold condition
The pivot point and the levels associated with it were thoroughly discussed. Hope its clear to you all
3
Calculation of PIVOT POINT, R1, R2, S1 and S2 levels
As mentioned above by me that the pivot points are Calculated by the preceding day's high, low and the closing price.
Note:
The calculation of The R1, R2, S1 and S2 levels depend upon the calculation of pivot points first.
Calculating Pivot points
Pivot point = [High(of previous day) + Low + Close]/3
R1
Resistance (R1) = [2 × PP - Low]
R2
Resistance (R2) = [PP + High - low]
Where,
PP = pivot point
High = the daily high
Low = the daily low
S1
Support (S1) = [2 × PP - High]
S2
Support (S2) = [PP - High - Low]
Woodies pivot point
| pivot point | (Previous high + previous low + 2 x previous close) / 4. |
|---|---|
| R1 | (2 x pivot) – previous low. |
| R2 | Pivot + high - low. |
| R3 | High + 2 x (Pivot – low) |
| S1 | (2 x pivot) – Previous high. |
| S2 | Current pivot – (R1 – S1) |
| S3 | Low – 2 x (High – pivot) |
Calculating the pivot points and its levels was thoroughly discussed and hope its clear to you all
4
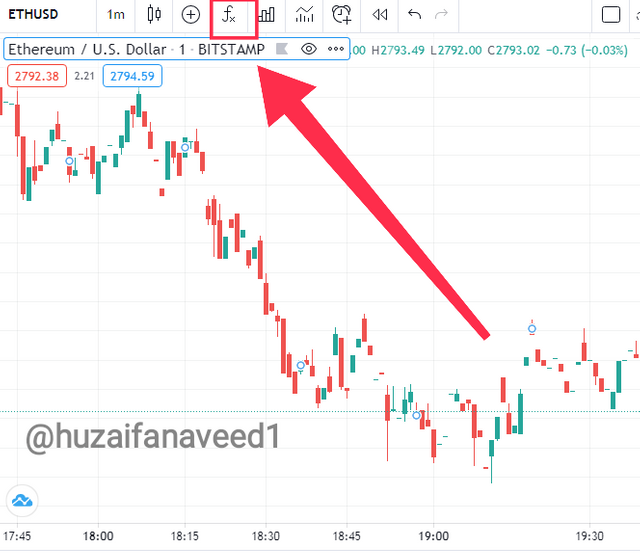
For answering this I will be demonstrating the example on tradingview
a) click on the indicator option (fx) as shown in my screenshot below.
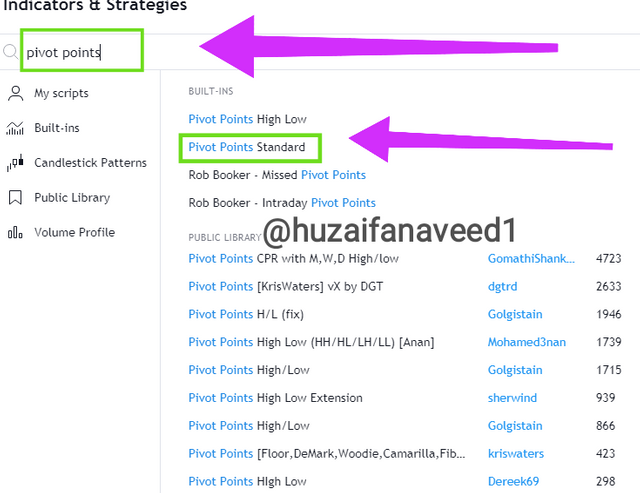
b) After that a drop down will open where a search bar is available. There write down pivot point and you'll get a list. On that click on pivot point standard and tap on it. As shown in the screenshot below.
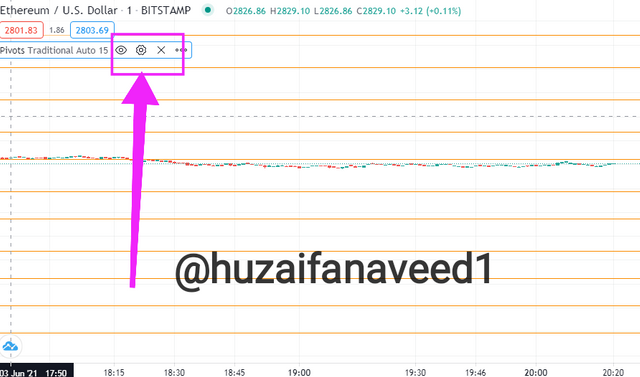
c) here you can see the pivot point getting activated. As I have showed in the screenshot below. You will have to click in settings options to configure according to your feasibility.
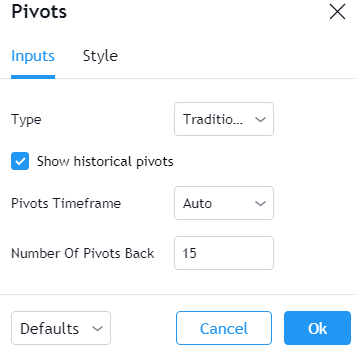
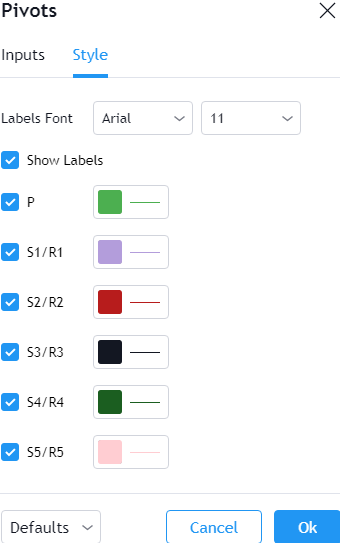
d) here the configuration list will open. With two options the input and style. I have decided to use the input settings as default and I have changed the style according to my feasibility as shown in the screenshot below.
e) The pivot point indicator is ready to use
5
The pivot point basically works on the high, low and closing of the previous day of an asset. We can analyze the market trend and the future movement as well if we do technical analysis correctly.
In this question I'll be demonstrating how to use the Pivot point on BTC/USDT chart.
Bull market
In a bull market we can analyze a couple of things from the pivot point indicator. Such as where to invest and where to pull out with profits. As I have explained that we can observe the Uptrend movement through the povot point and also some times when the market hits the resistance level it pulls back and that could be a buy signal for the traders to get assets in less price and then sell them off at good profits.
I will be demonstrating all of this in the pictures below
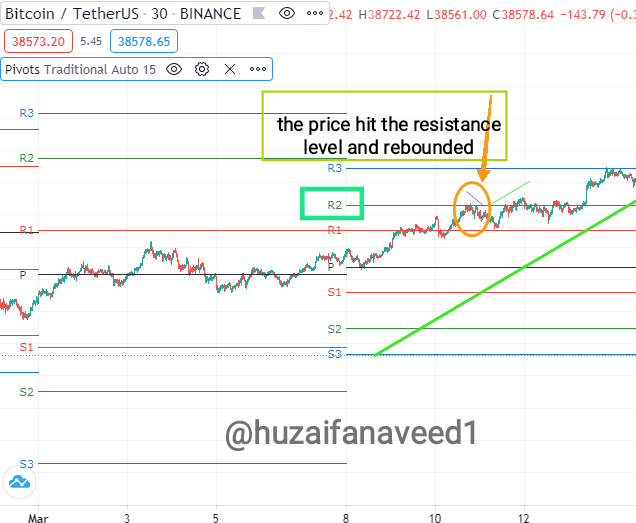
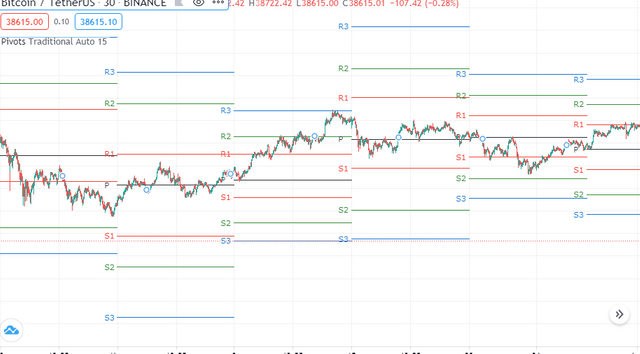
In this screenshot above we can see an uptrend movement and marked the reversal move as well as the Uptrend movement through which you could get some profits as explained above.
I have also marked the resistance levels for your clarity.
Bear market
In the bear market when the market price hits the support level it would either pull back in a reversal or break the support level in the downtrend movement.
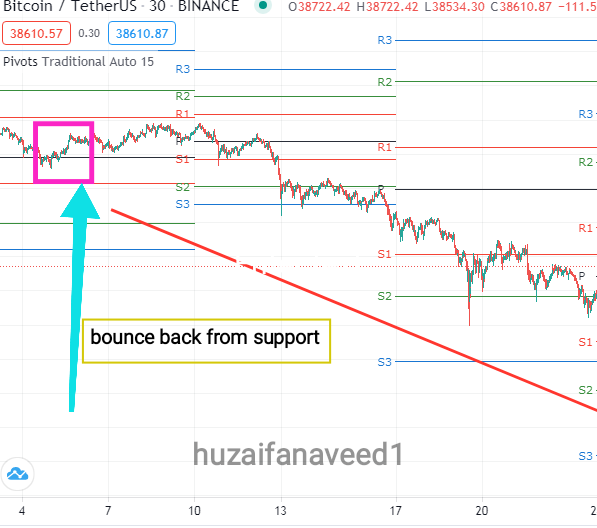
From the screenshot above as you can see i have marked the support levels in a bear market. There's a downtrend movement. Now if you have noticed even in a downtrend there are pull backs when the price hits the support level as I have marked. The traders can utilize these oppurtunities to make profits.
Breakouts in pivot point
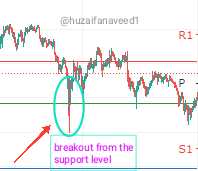
a) BEAR MARKET
As demonstrated in the screenshot below we can see the price breaking the support level and moving downtrend.
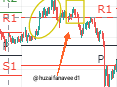
b) BULL MARKET
as demonstrated in the screenshot below we can see the market breaking the resistance level and moving in the uptrend direction.
The working of pivot point was thoroughly discussed and I hope its clear to you all
6
For explaining this type of trading I will be using the ADA/USDT chart
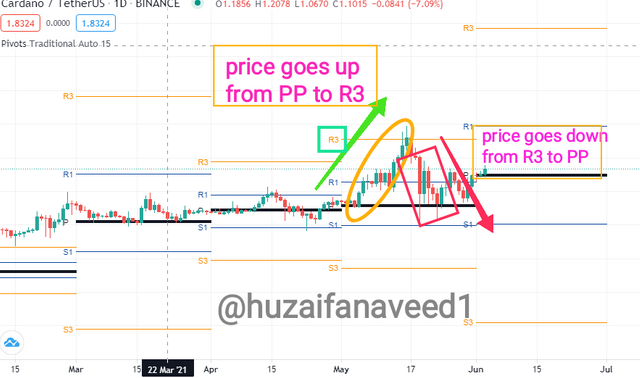
In this above mentioned screenshot we can clearly see a reverse trade movement.
We notice the price moving upwards from 5th May to 16th may from the main pivot point to the extent of the R3 level. There was a continuous uptrend movement. From our research we know that the resistance and the support levels also act as the reversal levels.
So in this picture we can see the price hitting the Resistance (R3) level then taking a pull back at 17th May and moving downwards towards the main pivot point.
Now as a trader when the the prices broke the Resistance (R1 and R2) levels and moved uptrend into a bull market, I would have sold my assets for getting a good profit. When the the price hit the R3 level and we observe a pullback, a downtrend movement then I would have bought the asset again in low prices ws the market turned in to a bear market.
The price followed downwards towards the main pivot point for 2 days, till 19th May and then again moved upwards towards the Resistance (R1) which means once again an oppurtunity to sell of profits at good rate or you could wait to see if the price would break out. Its upto your trading style.
reverse trading with Pivot point was thoroughly discussed and I hope its clear to you all
7
- I have said this in my previous assignment posts as well and I will write it down again that the most fommon mistake that the people do while trading is completely relying on one technical Indicator.
That is very foolish in my opinion. So I always use more indicators such as the RSI and MACD.
Secondly traders do not use stop loss while trading with pivot points. See theres no confrimation in the Cryptomarket that a price would follow in one particular direction for a given period of time. The indicators can only assist you but CANNOT trade for you. So putting a stop loss is rrally necessary as you never know when the orice would breakout below the support or resistance levels.
Furthermore you should have your own devised entry and exit strategies. As a trader myself I never completely rely on any Indicator. I have my own entry and exit strategies and when I see an oppurtunity of getting profits, I pull out with profits. You should get rid of FOMO (Fear of missing out). If you see you're getting profits in my opinion you should pull out with the trade by selling your assets in a profitable rate.
For example in this screenshot below I see the price of the coin hitting the Resistance (R1). IF I had bought the asset at the level of main pivot point I would sell it as soon as it hits the R1. I will not wait for it to breakout as I dont know for sure, I could go into a reverse direction as well.
8
Lets shed some light on the pros of using pivot points
- You get an excellent OVERVIEW of the market since you get the high and low of orevious day and you can compare the prices before entering in with your trade
- you get to know about the bull and bear market. If the price is above the main pivot point then it is a bull market. If it is below it is a bear market.
- very user-friendly. You don't need any technicalities for oivot points.
- gives you an excellent idea for your entry and exit strategies to make profits.
these are the most amazing advantages of the Pivot point which makes it very good to use
9
For this task I will be using the ADA/USDT chart from the 2nd june - 4th june using a 15- minute timeframe.
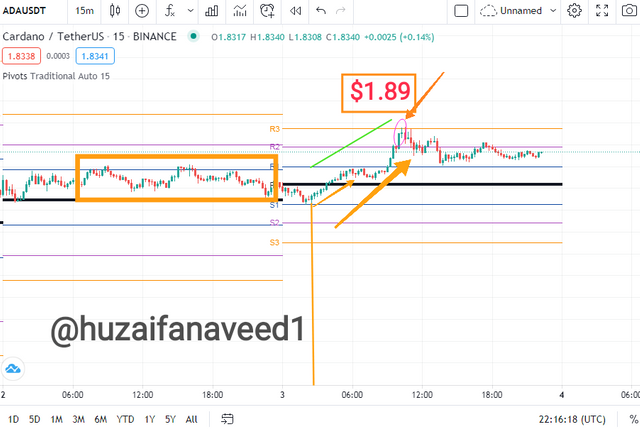
2nd JUNE
So on june 2nd we see the opening of ADA at $1.73 from where it regresses to the main pivot level and then takes an uptrend. As soon as it hits the Resistance (R1) the price isn't able to cross the R1 and regresses again. On the whole 2nd june the prices did not break the R1 and the price was beating around $1.7 -$1.8
So there wasnt much volatility.
3rd june
The next day the market opened below the the pivot level and continued a bear trend for an hour and thirty minutes hitting the lowest price of the day ie, $1.71
At 2:30 the price rebounded from the support(S1) and moved upwards creating a bull market. The price reached the main pivot level and brokeout to Resistance (R1) hitting the price $1.76
It wasn't able to breakthrough the R1 and pulled back for about 45 minutes and almost hit the main pivot level.
From this point at 8:00 the price took a sharp uptrend movement and continued in a bull market. It brokeout the R1 level then broke out the R2 level and hit the R3 level 10:00 am reaching the higesht price of 3rd june. ie, $1.89
From R3 the price pulled back and reached the R1 level and since then the price wasn't able to hit the R3 level again.
It closed at $1.82.
My prediction:
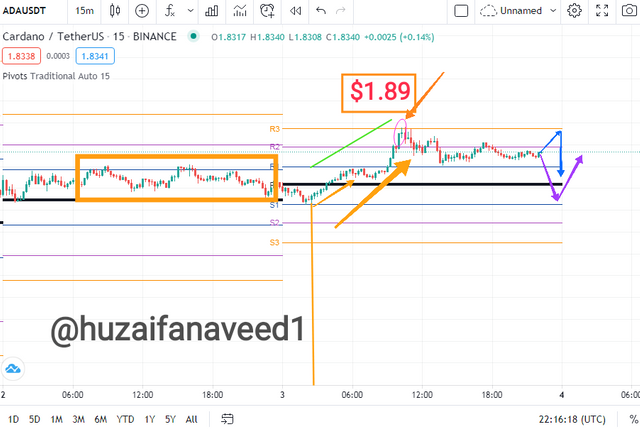
- Analysing the chart critically I think the prices the will go up in the first half of 4th june. It will hit the R2 level and might breakthrough to the R3 level.
OR the price would hit the R2 level and rebound from there and follow a bear trend. But no matter what, when the day starts the prices will go up initially.
after hitting the Resistance level it could rebound as well and go beyond the pivot point uptill the Support (S1) and then go back up again.
So this was my Analysis on ADA
10
CARDANO
Cardano (ADA) was launched in 2017 by Charles hoskinson who also co-founded Ethereum blockchain.
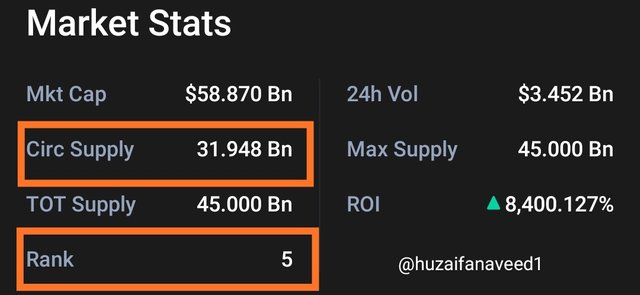
Cardano currently lies at No.5 position in the list.
It is one of the top Cryptocurrencies with a third generation scientific blockchain.
It's a well designed complete project which works with its own coin named ADA. It has oowerful smart contracts through which it has grown so much that it is amogst the top 5 largest Cryptocurrencies.
Sharing details about ADA.
Why CARDANO?
- It has huge circulating supply of 31.9 billions which is way ahead of even Bitcoin (18 billion)
- good scalability which means fast transactions within 10 minutes
- transaction fee as low as 0.16 ADA.
- It is amongst the top 5 largest Cryptocurrencies.
- I have invested in ADA so it will be easy for me to do techinal Analysis.
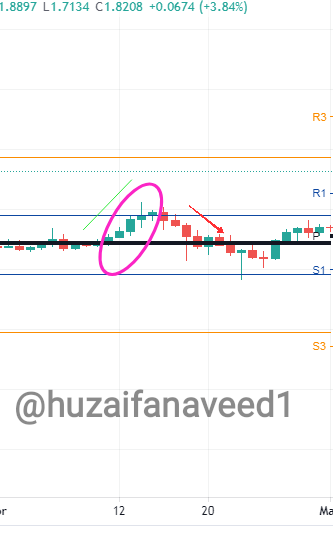
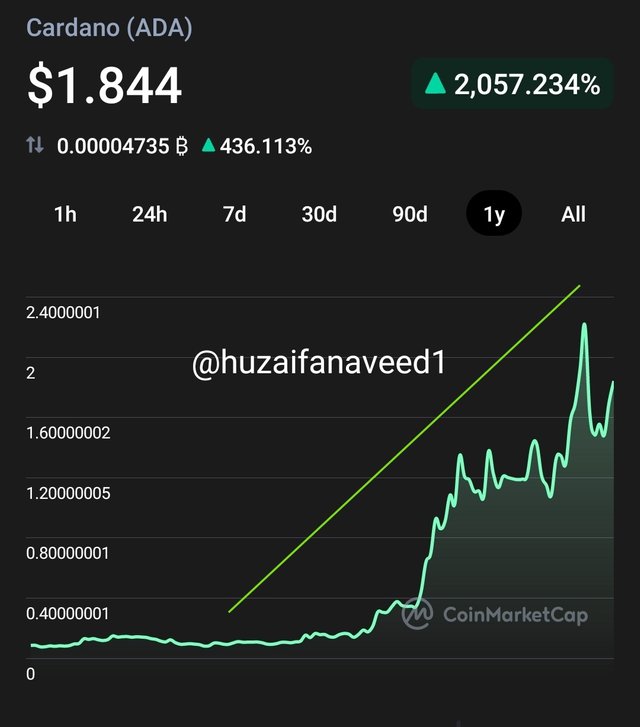
Weekly chart
We can clearly see that last week the price of ADA started below the pivot level after ehich it hit the Support level and rebounded. After that it hit the resistance level but did not breakthrough throughout the week eccept for the 3rdJune where it broke the Resistance (R1 & R2) levels and hit R3 but then rebounded again to R2.
We can also see it on the RSI indicator that the price is closer to the 70 line which indicates an overbought.
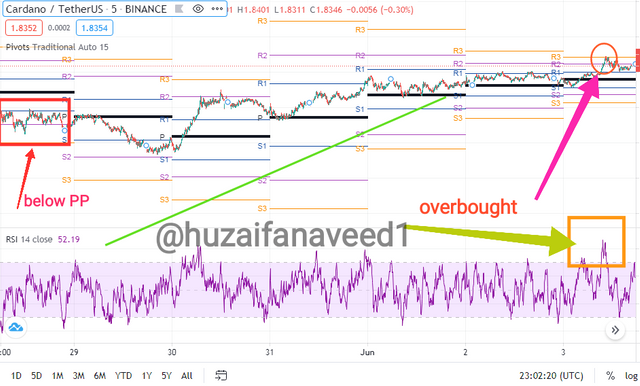
Daily
Now if we observe the daily chart we can see that the price at first took a slight downtrend movement from the Resistance (R2) but then again hit the R2. It wasn't able to breakthrough R2.
We can clearly see that it is currently a bull market and we are in overbought conditions. So if you have ADA with you when you bought them in OVERSOLD condition you could sell them out now for good profits.
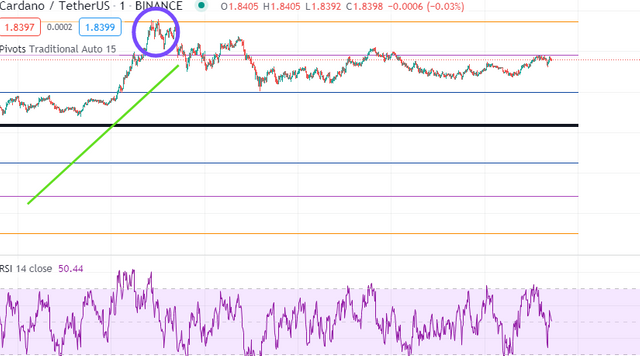
My prediction for the next week would be that the trend would follow an upward direction. It will at first hit the R2 level and might not breakthrough it. But the price will not fall upto the support level in 1-2 days. It might get low in the upcoming days but not imminently.
The price might also break the R2 level and hit the R3 level taking the market into an overbought conditions as shown in the screenshot below
Next week prices
| PERIOD | PRICE FORECAST |
|---|---|
| 24hrs high | $1.88 |
| 24hrs Low | $1.75 |
These are my predictions.
One of the most lengthy assignments of the week which was research based. In this assignment we completely understood the Pivot points, the levels and their Calculation. We learned how to apply them on chart and the configurations.
We learned about some trading strategies such as the reverse trading with the pivot points.
After that we took real life chart examples on different coins to demonstrate trading with pivot point with different time frames alongside other indicators.
I did a complete technical analysis on ADA and also forecasted the next week's prices.
Conclusively thank you professor @stream4u for this lenghty and informative lecture. The research work required for this assignment was huge and I'm glad we got to learn about this important indicator.
It took me straight 5 hours to compose this assignment post and I enjoyed making it. Hope you have a good read too.
Thank you.
ps: the screenshots were taken from tradingview
Regards,
@huzaifanaveed1

Hi @huzaifanaveed1
Thank you for joining The Steemit Crypto Academy Courses and participated in the Homework Task.
Your Homework Task verification has been done by @Stream4u, hope you have enjoyed and learned something new.
Thank You.
@stream4u
Crypto Professors : Steemit Crypto Academy
#affable