Steemit Crypto Academy Season 4 Week 2/ Homework Post for Professor @reminiscence01/ Technical Indicators,
It is funny how time flies really fast, we are now in the second week of season 4 of the crypto academy and I am really excited about the large information gathered during the course of the academy. I must say that there is a lot of learning process going on here and I am thankful for that. This week I will be answering the questions by professor @reminiscence01.
Question 1
(a) In your own words, explain Technical Indicators and why it is a good technical analysis tool.
Technical indicators can be described as signals gotten from the detailed study of price and volume either past or present. A technical indicator is a good tool or instrument strategically used to determine or predict the future price of an asset or a token.
Technical indicator are a tool often used by traders to determine the perfect time to enter into or exit a market. It also displays opportunities for traders to get desired profit. As good as it is to make use of trading indicators, we must also bear in mind that using a single indicator may sometimes mislead us and we need to combine different indicators in order to obtain an accurate result. Traders must also understand that there are different trading indicators to suit different trading styles, so it is important to work with a trading indicator that perfectly fits our style of trading.
The importance of technical indicators.
Technical indicators are great tools for the confirmation of possible breakouts or weakness.
Technical indicators are a great tool to help traders predict future prices.
Technical indicators provide a good signal point that shows the right time to enter or exit a trade.
(b) Are technical indicators good for cryptocurrency analysis? Explain your answer.
Technical indicators are a great tool for technical analysis and it is important for traders to make use of indicators before making any trading decision.
With technical indicators, it is possible to determine the price of an asset as well as understand if the price is moving in an upward or a downward direction. The understanding of price movement will clearly help traders to know the perfect time to enter and exit a trade.
A good trade indicator will also help traders maximize the option of stop loss and take profit. Prices associated with cryptocurrency assets are extremely volatile and traders have the tendency to either make huge profits or losses greatly. However, the technical use of a trading indicator could help minimize loss by using the option of taking profit and stop loss on the trade indicator.
(c) Illustrate how to add indicators on the chart and also how to configure them. (Screenshot needed).
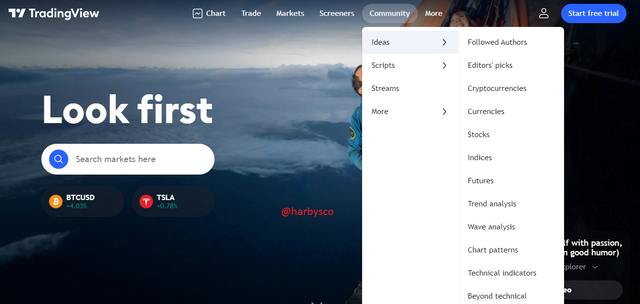
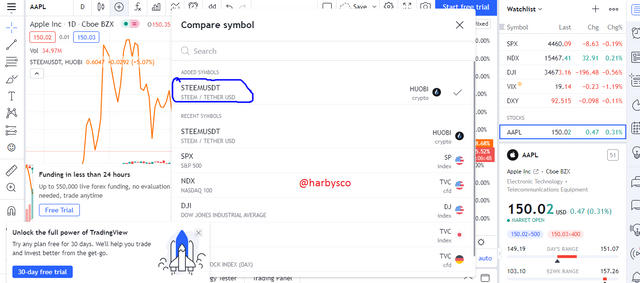
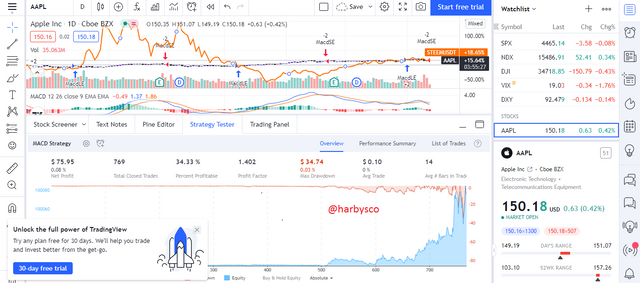
I am answering this question by logging in to www.tradingview.com. I am analyzing STEEMUSDT for the purpose of this post and all I had to do was to click on the chart and then I proceed to select STEEMUSDT as the pair I would love to analyze here.
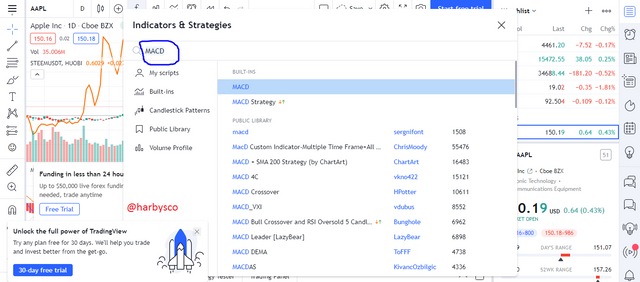
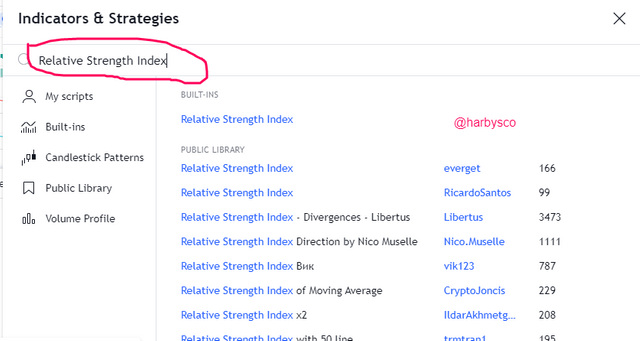
I clicked on the fx function provided here and I selected the indicator I would love to work with, in this case, I selected MACD. After the indicator has been selected, there is a displayed option for formatting.
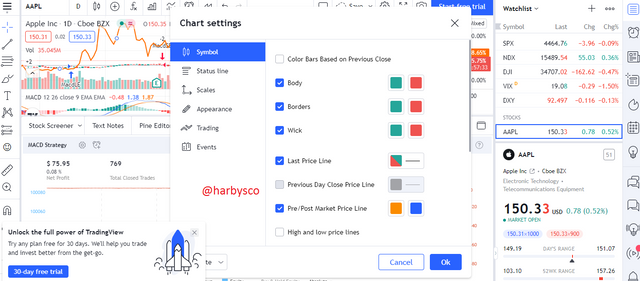
I decided to change some of the colors to my taste and my editing came out quite cool.
Question 2
(a) Explain the different categories of Technical indicators and give an example of each category. Also, show the indicators used as an example on your chart (Screenshot needed).
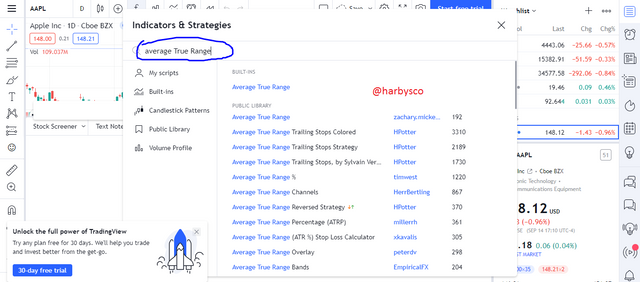
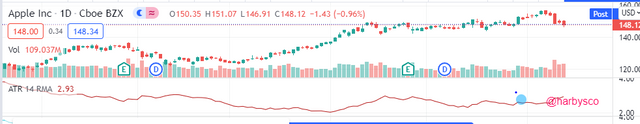
• Volatility-Based Indicators.
The market is a completely volatile one as we already know, this means that there is going to be a price change from time to time. There are indicators that help us make good trading decisions even with the extreme market volatility, these indicators are known as volatility-based indicators. This indicator makes it easy for traders to identify when the price of an asset is either high or low. Examples of such indicators are Average True Range (ATR), Bollinger Bands.
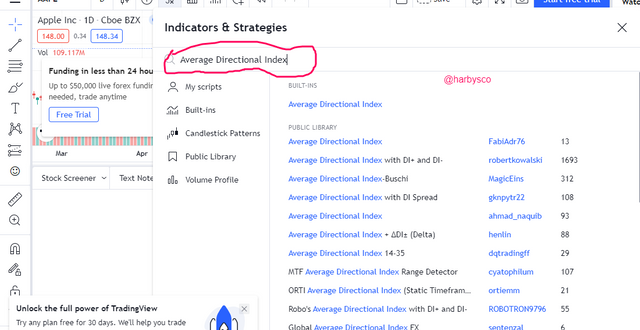
• Trend Based Indicators.
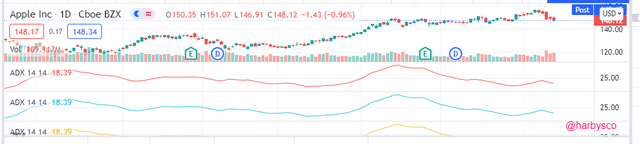
Trend-based indicators help traders determine a particular trend of a given asset. Understanding trend-based indicators will help traders understand if there is an upward or downward price movement and as such provide them with an edge of understanding the market. Trend-based indicators happen to actually be one of the easiest available indicators because a single glance at the chart will definitely provide answers to questions about a price trend. Example is: Average Directional Index (ADX)
• Momentum Based Indicators.
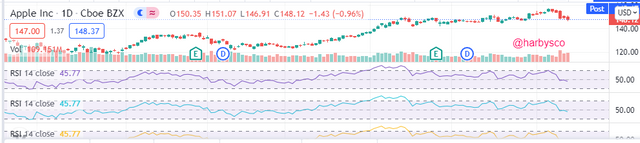
Momentum-based indicators actually display the strength in a coin pair. This indicator is also known as Oscillators and it often indicates an overbought or oversold asset. When an asset is overbought, it will reflect that the price of that asset becomes really high and then when it is oversold, the price of the asset also becomes relatively low. Examples are: Moving Average Convergence Divergence (MACD). Relative Strength Index (RSI), Stochastic.
(b) Briefly explain the reason why indicators are not advisable to be used as a standalone tool for technical analysis.
As good as technical indicators are, it is not advisable for it to be used as a standalone tool as it cannot be trusted to give a hundred percent accurate result. It can be a really painful experience when funds are lost as a result of generated fake signals. Therefore, it is better to always use technical indicators with other technical analysis tools as this will help traders in detecting fake signals.
By combining indicators with other technical analyses, it becomes possible to leverage on a more efficient signal to trade with rather than been dependent on an unsafe signal. Having established the fact that, the use of a single technical indicator could not give an accurate result. The combination of different technical indicators (that blends perfectly), will definitely provide traders with the best signal to determine the right time to enter into a trade and take profit from it.
(c) Explain how an investor can increase the success rate of a technical indicator signal.
It is important for investors to understand trading signals and also understand that it needs to be properly combined with other technical tools. The success rate of technical indicators can be improved by traders when they are able to combine it with other technical tools in order to come up with an almost perfect outcome.
CONCLUSION.
Trading indicators are very important for every trader and investors but regardless, other technical tools must also be studied and understood in order to get a perfect result. There was a lot of added knowledge obtained during the course of writing this post and I am glad I participated in the task.