Crypto Academy | season 4 | week 2- homework post for @reminiscence01
Hello professor @reminiscence01, thanks for the topic treated for this week. It my pleasure to participate in your homework task for the week.
Here is the submission of my homework task below.
Technical Indicators
When trading, the first thing that comes to the mind of a trader is making a profit. To make a profit, technical indicators are used to graphically get information through mathematical calculation on price and volume to predict the next possible outcome. Technical indicators are precise and at the same time saves time.
In the market of finance, stocks, assets, futures, and commodities are usually analyzed using technical analysis. In order to effectively analyze the aforementioned, technical indications comes in handy. Technical analysis is technically a method of forecasting price movement by using the past to predict the future through the use of past prices, volume, and open interest.
Indicators in this context are price data points. It indicates and provides specific market information regarding the past price of a stock, asset, and other commodities as the case may be when it was oversold and overbought, and other relevant information. This is to say indicators make the market clear by providing and generating resource data to confirm signals as well as evaluating the characteristics of an asset or its price.
Because of its efficiency and effectiveness, traders and investors mostly rely on technical indicators when they're making cryptocurrency investments and other investments. It is a good technical analysis tool in the sense that it allows traders and investors to identify entry and exit points and also the avenue to confirm, evaluate and predict price behavior.
The fact that technical indications are based on statistical, historical, and mathematical calculations makes it reliable to the extent of investing based on its positive analysis. Without these technical indicators, the investment of investors and traders would be at risk because they technically serve as a guide, guiding traders and investors.
Base on money crashers, there are some technical indicators which are so accurate that they form the basis for popular in-depth research and analysis tools like Trade Ideas and Stock Rover. This shows how relevant these technical indicators are.
B. Are technical indicators good for cryptocurrency analysis?
First things first. First of all, cryptocurrency rates are usually calculated through algorithms. These algorithms can also be considered as technical indicators. Technical indicators over the years have proven to be a good guide to both investors and traders. But can the same be said for cryptocurrency analysis?
For traders to effectively predict the price movement of cryptocurrency, indicators are needed. For example, it isn't easy to predict the price of bitcoin unless indicators are used. With the help of technical analysis and indicators, data is drawn from various mathematical models of likely price action which in turn enables traders to make their decisions and predictions.
A good entry point gives birth to a successful business. For example, volume indicators state how the volume changes over time, and also specifies how many units of bitcoin are being bought and sold over time. Trend indicators tend to indicate the direction the market is going. Based on it, a trader can base his decision if there is a good feeling that the price will rise or probably fall.
Apart from what I started earlier, the effectiveness of technical indicators has been confirmed in the currency and stock markets.
C. Screenshots portrayed below.

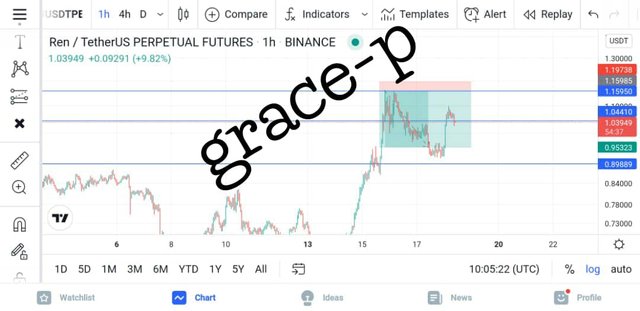
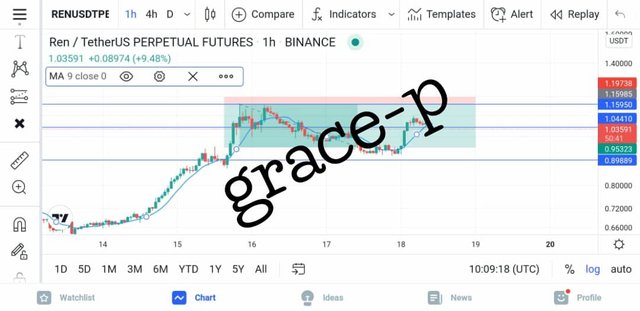
The first screenshot portray "Trading view" which is the best app to use for trading analysis.
You'll open the trading view app then you'll come to a particular pair, click on charts...
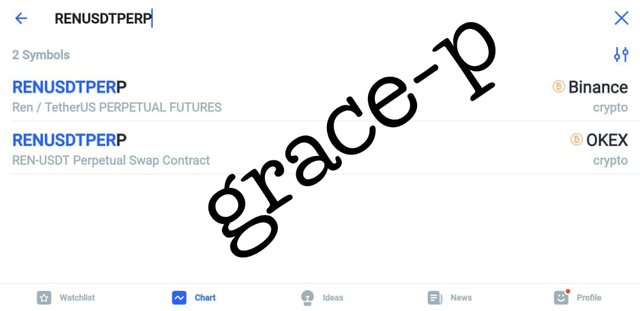
On the next screenshot, you'll search for the coin and the pair and you'll analyse.
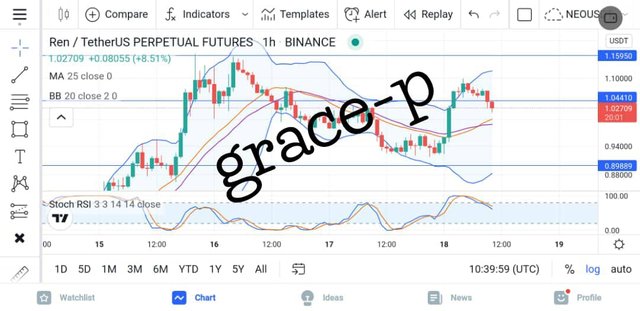
Then, you'll click on fx indicator, you'll see a search section
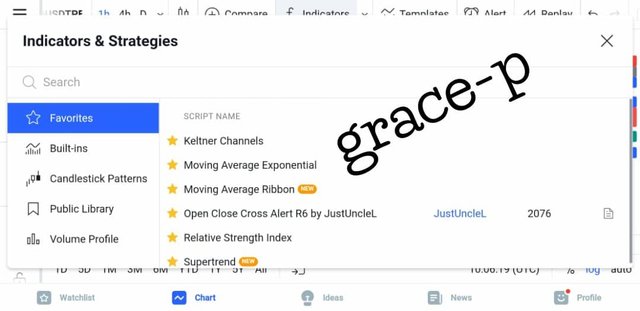
Here we'll search out what we want to.
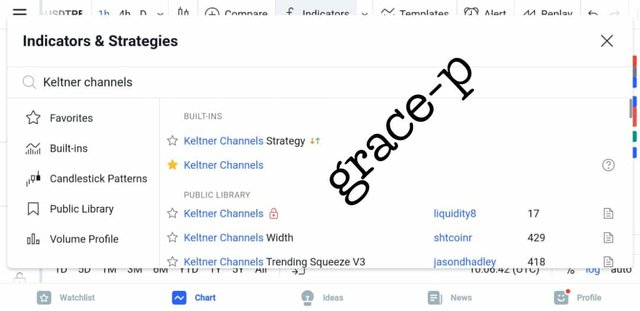
I searched out and clicked on keltner channels.
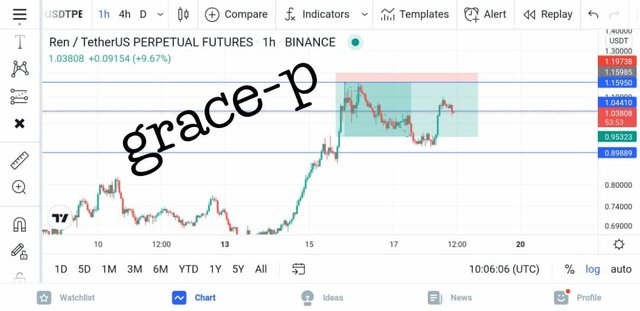
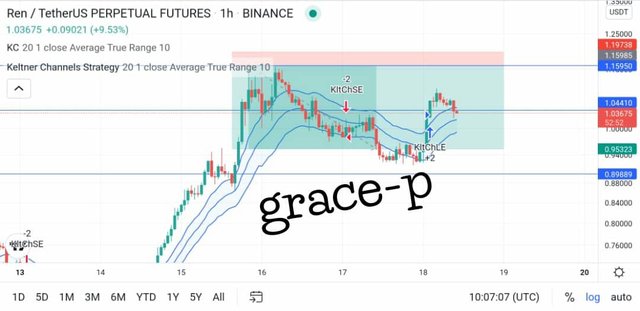
On the charts, the keltner channels has been added to the charts which is adding a more significant way of trading to the chart.
This keltner channel helps in giving a bounce and support.
The next is to show how to edit or make use of the indicators. How to configure the indicators.
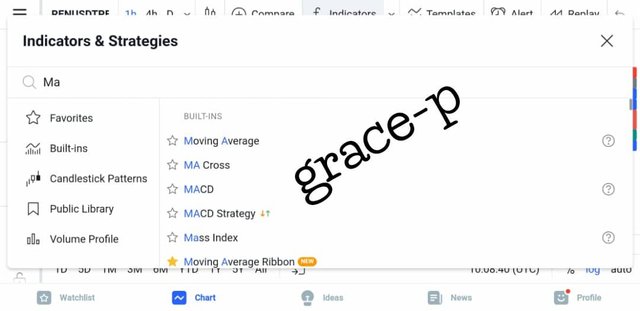
After selecting any indicator, another MA is been selected. That is, the moving average.
Looking at the top left of the chart.
We'll click on MA close, click on the indicator, on the top left then we'll see MA close 0.
Click on the settings button there and then set the style which is the colour, visibility, opacity, inputs(the lengths.. We have the MA25, the MA50, The MA100, the MA200.
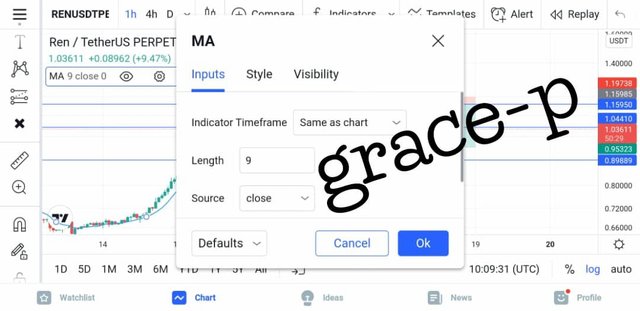
You can configure these through the settings section.
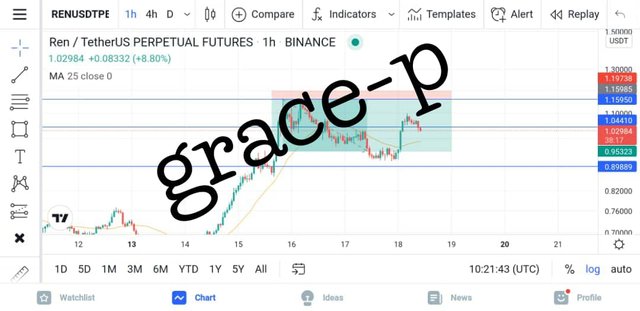
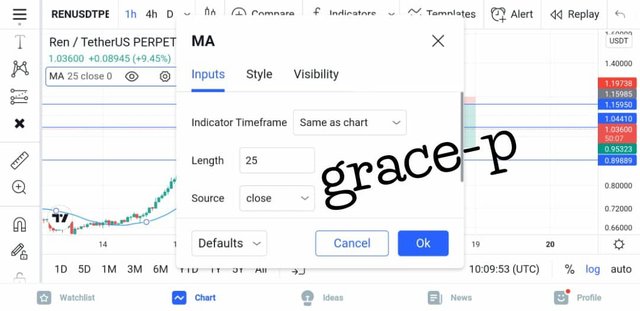
The last one shows that the MA has been changed to 25 and that's it
Categories of Technical Indicators
In the world today, there are diverse categories people of available technical indicators for both traders and investors. For profitable trading, it is important to know the type of indicator to use and how to use them based on your type of investment and trading style. These indicators are divided into categories.
1.Trend Based Indictors
For an investor to do well in the market, he needs to understand the current trend. A trend is generally a line of the general direction of movement. Trend indicators tend to indicate the direction the market is going. So it's either you fall in or fall out. These indicators are used to determine the strengths and weaknesses of current market trends. Because of the way these indicators move between high and low, they are sometimes called oscillators. They serve as a medium through which traders and investors understand the latest trend to ascertain the price of assets as well as identifying trending market conditions and range-bound markets. There are a variety of trend indicators like Average Directional Index ( ADX), Moving Averages ( Simple/Exponential), and so on.
2.Volatility Based Indicators
Volatility-based Indicators on the other hand consider the price changes. They are used to measure market swings and plantation in market prices. This is indicated by the up and down movement on the price chart. The presence of gh volatility means a price is fast changing. It balls nothing about direction, just the range of prices. While low volatility on the other hand means small price moves. Examples of volatility-based indicators include Bollinger Bands, Average True Range (ATR), Ichimoku Kinko Hyo (AKA Ichimoku Cloud), and so on.
3.Momentum Based Indicators
Momentum-based indicators are used to tell how strong a trend is and when a reversal will occur. These are mainly useful for picking out price tops and bottoms. They are also called oscillators because they give an idea of when the price of an asset is overbought or oversold. This gives investors the opportunity to capitalize e the use of their opportunities. Momentum indicators include Rethe lative Strength Index (RSI), Stochastic, Average Directional Index (ADX), and Ichimoku Kinko Hyo.
Is it advisable to use technical indications as a standalone tool for technical analysis?
Though it can be used as a lone strategy, it is tactically safe to use technical indicators as a support tool alongside other technical analysis tools. This is to say there are reasons why indicators are not advisable to be used as a standalone tool for technical analysis.
Technical indicators have their weaknesses. It's noteworthy to note that technical indications are not 100% accurate. This simply means technical indications only indicate the possible outcomes, not what the actual outcome will be. Flowing from this, it is advisable to not only stick to technical indicators.
In addition to this, different technical indicators may show different things on different timeframes. This might lead to confusion and contradiction where one contradicts the other. Also t, he uses and presence of these indicators connotes the absence of external insights. As a result of this, investors and traders are blinded by what they see and might in turn affect the way they reason and their decisions.
Apart from this, there is the notion at times that these indications give false signals once in a while. This is because these indicators have their weaknesses and are not 100 percent accurate because it only foresees the possible outcome, not the actual outcome.
However, these stated points are not meant to discredit the credibility of technical indicators, it is to point out the fact that it's advisable not to use technical indicators as a standalone tool for technical analysis. An investor or trader should not expect too much from an indicator.
Can an investor increase the success rate of a technical indicator signal?
A lot of traders and investors analyze stocks and assets based on revenue, valuation, and industry trends. The purpose of technical indicators and analysis is actually to predict price movements by examining historical data, mainly price and volume. These in turn help and guide investors. An investor can increase the success rate of a technical indicator signal by choosing the right approach and the right strategy.
When traders buy and sell at certain levels, price patterns appearing between these levels, price oscillates and thereby creates short patterns.
Every market has its psychology and philosophy. An investor must be well versed in the rudiments of both. An investor should be able to use price action to improve the way he looks at charts and also his performance. Trading volumes like metrics also provide clues. It states whether a price move will continue or not.
It's pertinent to note that indicators can be used to generate buy and sell signals. If an investor uses it and what he has to his advantage, he can in his way increase the success rate.
Hello @grace-p, I’m glad you participated in the 2nd week Season 4 of the Beginner’s class at the Steemit Crypto Academy. Your grades in this task are as follows:
Observations:
This is correct.
Recommendation/Feedback:
Thank you.