Steemit Crypto Academy Season 3- Dynamic Course for Beginners - Week 7 by @lenonmc21/Analysis and Trading with the indicators "Stochastic Oscillator +" Parabolic Sar "
Right before I jump into providing answers for the homework task for this week, I would love to appreciate @lenonmc21 for this week’s task and also go ahead to appreciate the team behind @steemitcryptoacademy for the hard work and consistency in helping people learn. Without waste of time, I will approach the questions of this week to the best of my knowledge.
Theory (No images)
Define in your own words what is the Stochastic Oscillator?
Stochastic oscillator is a momentum indicator that signifies an overbought or oversold trade occurrence, taking into clear consideration the movement of price of that particular trade within a given point in time. The concept of Stochastic Oscillator makes it possible for traders to easily predict whenever there is a change in signal direction of the price of a trade. The Stochastic Oscillator is very important and useful for traders but traders must try to have a deeper knowledge about the indicator in order to avoid misinterpretation and confusion with the use of the indicator.
Stochastic Oscillator is a great indicator for users but it definitely has its own shortcomings and in order for any trader to successfully get the most of this indicator, they must be ready to get more knowledge about the possible disadvantages that the indicator may offer as this will help them avoid it and get the best use of the indicator.
Advantages of Stochastic Oscillator.
The indicator provides an obvious and clear point of entry and exit, which makes it easy for traders to understand when it is the perfect time to get in and out of a particular trade.
Traders are free to set their time limit, the signals on the indicator appear as frequently as the time set.
The indicator is available on several trading chart patterns.
It is extremely easy to understand presenting little to no form of complexity.
Disadvantages of Stochastic Oscillator.
The over-use or lack of understanding of the indicator could result in the production of false signal which will certainly get the trader to make trading mistakes.
If it happens that trade occurs against the available trend, it could result in having an overbought or oversold trend for an extensive period.
Explain and define all components of the Stochastic Oscillator (% k line, % D line+ overbought and oversold limits).
%K line: This is a line that could be termed to be stochastic in itself, the line indicates a fast movement and it is drawn with a supplement which appears to move in a likewise manner, traders use it to figure out the indicating presence to either purchase or sell. The calculating formula is:
>%k Line =100 X (Current close-Lowest low of the period)/
(Highest high of the period-lowest low of the period).
It may appear in this short format as well: 100(C-L14)/ (H14-L14)
In this case, each of the term used will interpret to mean the complete terms stated above.
%D Line: This line begins from a similar point as Line %K, this line is the most important of the lines because it is the one used to determine trading signals, it is drawn in a discontinuous manner and it is characterized by a sluggish movement pattern.
%D Line =Simple Moving Average of %K.
Indicators makes it clear to traders as to what point the price will turn in a specific direction and of course this is an excellent signal indicating a perfect point of trade entry and exit for traders and usually 14 past periods are used to get this point.
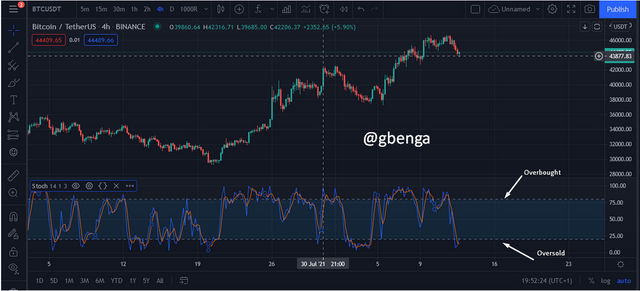
Overbought limit: This shows a strong trend in buying order, if the signal shows a strength of 80 over 100 for a long time is believed that there is a strong buying force going on here and it might close near the top.
Oversold limit: The signal here indicates a lot of selling pressure going on and there is a great probability for the trade to close at the bottom and a likelihood for reversal in trend pattern to occur. If the signal displays strength of 20 over 100 for a long time, it indicates a serious selling force.
Trend reversal: This point of indication occurs after a strong selling or buying force has been displayed and then a point of reversal occurs from there.
Briefly describe at least 2 ways to use the Stochastic Oscillator in a trade.
Stochastic Oscillator is a good way to identify bullish and bearish trends. While making use of the trend however, we must work with the mind-set that no trade indicator is going to provide us with a perfect type of trend but it will help us work with available probabilities.
Bullish trend is an indication of a continuous drop in the price of the asset reviewed, In the case of a bullish trend, the stochastic oscillator will form a higher low while the price will signify a lower low and there is an indication that there might be a bullish reversal at the peak of the trend.
Bearish trend on the other hand is an indication of a continuous rise in the price of the reviewed asset. In this case, the stochastic oscillator will form a lower high while the market price will reach a higher peak. The peak of this trend mostly indicates a bearish reversal.
Define in your own words what is Parabolic Sar?
Parabolic Sar was developed by a well-known technician with the name J.Welles Wilder, Jr. This trade indicator shows traders a good point of entry and exit. The acronym SAR means stop and reversal, the indicator is used at a point when a particular trend has overused its strength and there will be a reversal to the movement of that trend which makes it a good indication for traders to identify entry and exit points. We must however also note that Parabolic Sar does not give us a perfect trend signal but it can be made more effective when we combine the knowledge from this indicator with other indicators.
Explain in detail what the price must do for the Parabolic Sar to change from bullish to bearish direction and vice versa.
This indicator is showcased with dotted lines, once the dots are found underneath the prices, it is considered a bullish trend. In order for the line to indicate an upward trend it means that the price will move from the bottom to the top which strongly signifies an upward drive, an halt to this trend will create a reversal to pattern movement and then price will begin to move from top to bottom signifying a bearish trend.
The dots on the indicator showing when the dots are found above the price signifies the presence of a bearish trend and in this case the price is moving from top to bottom, a long trend will most likely lead to a halt at some point and then a reversed action when prices will begin to move from bottom to top signifying the occurrence of a bullish trend.
Briefly describe at least 2 ways to use Parabolic Sar in a trade.
To indicate exit points.
Parabolic Sar is a great indicator that describes a good point to exit from a trade, the indication shows clearly when there is going to be a halt and reversal to a particular trend in price and at that point, a good trader knows how to take advantage of the situation and then either exit or enter into a trade.
To provide a good stop loss.
It is a good thing for a trader to be able to set a reasonable stop loss as it will help the trader to study the direction of the trade and then get a good point to take available profit and move out of the market without getting additional loose, Parbolic Sar provides this indication to traders easily without stress.
Practice (Only use your own images).
Stochastic Oscillator
In other to add Stochastic Oscillator to a trading chart, I will be using Tradingview.
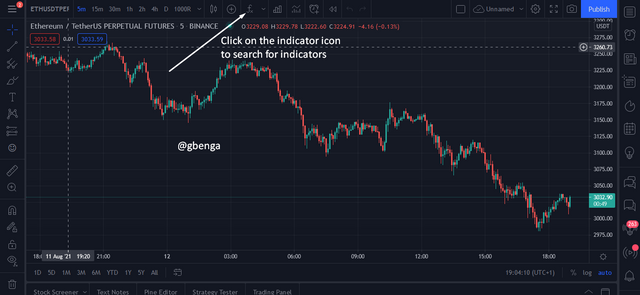
(https://www.tradingview.com/) to analyze the chart. On tradingview, the first thing to do is pick a trading pair which you want to analyze or trade (for me, I will be using the ETH/USDT trading pair as I really like to trade coins with good volumes). After picking the pair, a trading chart of the pair price history is displayed of which traders can utilize to determine their trading decisions (technical analysis).
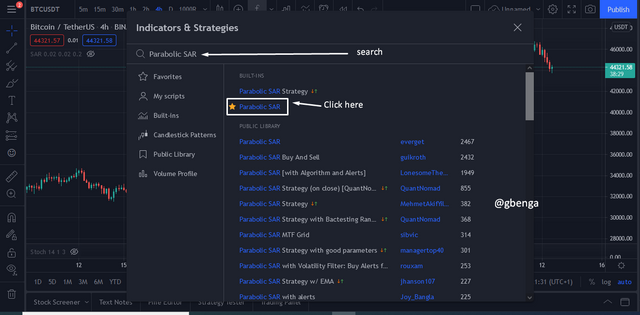
To add Stochastic Oscillator to the chart, click on the indictors and strategy icon on the top corner of the chart tool bar so as allow the search of different indicators.
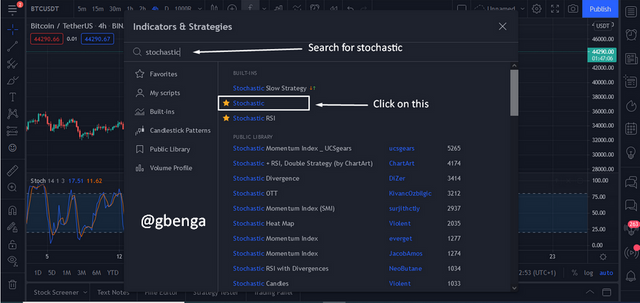
Although, I already have stochastic as among my favourite indicators but for the sake of this post, I will show how to get the stochastic oscillator. To get the stochastic oscillator, you click on the search button and search for stochastic. It will appear on the tab after which you can click on it.
The Stochastic Oscillator appears below the chart with an orange and blue line which are the Line %K and Line %D The %K is the blue (white line for some), and the %D is the Orange (red line for some).
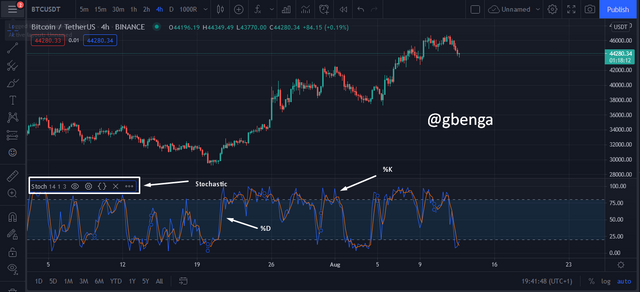
The Stoch moves on default from 0 to 100, and it is undersold at 20 and oversold at 80.
Parabolic Sar
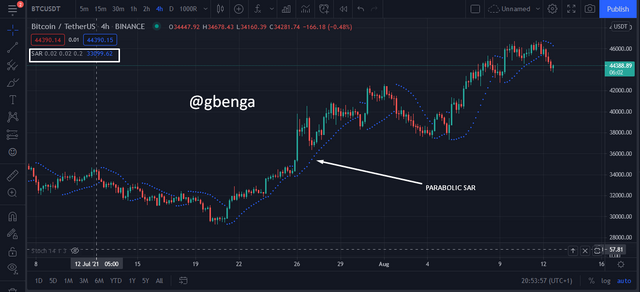
Parabolic SAR as the name implies create a Parabola on the price chart. It is used to identify stops and reversals. To add Parabolic SAR on a chart, the first thing to do is to click on the indicator icon on the tool bar, and search for Parabolic SAR. After the search, the Indicator appears and it is clicked on so as to add it to the chart. If using tradingview, you can add it to the favourite. It has been part o my favourite indicators.
The Parabolic SAR appears as a parabola on the price bar on a downtrend and below the price bar in an uptrend.
Adding Stochastic Oscillator and Parabolic SAR in a chart
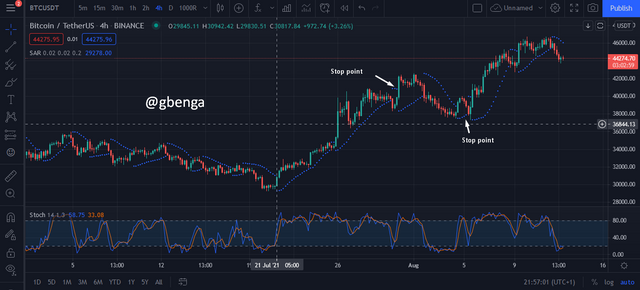
When it comes to this, I am very careful as I do not trade without a strategy and before I can confirm a strategy, i must have traded it (backtest) over 50 times. with this, I will just give this as an hypothesis and not a financial trading advice. One good thing about Oscillators is they tell when a market is overbought or oversold and this is just what Stochastic Oscillator does while Parabolic SAR gives an entry and exit.
Combining the both indicators make it easy to identify potential entry and exit. In an uptrend, the parabola above the price stick shows a stop point as well as parabola below the chart in a revesal in the downtrend is a stop point
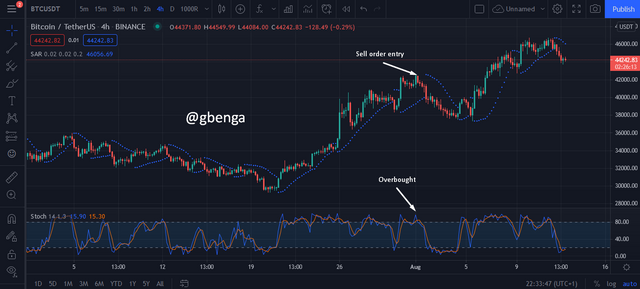
In other to take a long position, wait for the extreme point of the short parabola in the chart. when this is confirmed, ensure that the Stoch is at an oversold level and wait for the first candle stick to be Bullish, which calls for a reversal. After the first candlestick of the oversold Stoch, a long call is taken. The opposite is for a short position.
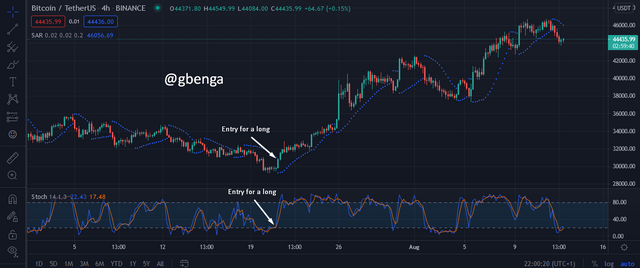
For a short position, follow the previous uptrend to its extreme point (EP) on the Parabolic SAR, also confirm that the STOCHASTIC OSCILLATOR is overbought then place sell order on the stop limit of the Parabolic SAR or after the first reversal candlestick.
Conclusion.
Every trader must understand the idea of charts and indicators and that is one aspect that @lenonmc21 has tried to build all through the journey on this academy, I am thankful for the impacted knowledge because this topic really gave me reasons to research even deeper which I am thankful about.
Congratulations! Your post has been selected as a daily Steemit truffle! It is listed on rank 16 of all contributions awarded today. You can find the TOP DAILY TRUFFLE PICKS HERE.
I upvoted your contribution because to my mind your post is at least 6 SBD worth and should receive 28 votes. It's now up to the lovely Steemit community to make this come true.
I am
TrufflePig, an Artificial Intelligence Bot that helps minnows and content curators using Machine Learning. If you are curious how I select content, you can find an explanation here!Have a nice day and sincerely yours,

TrufflePig