Crypto Academy / Season 3 / Week 5 – Homework Post for [professor @lenonmc21] Trade with ‘Simple and Exponential Moving Averages’ + application of ‘Fibonacci Retracements’
.png)
Hello steemians, am glad once again to participate in this week’s lecture and homework task. I read through the lecture and have learnt a lot through it. Thanks Prof @lenonmc21 for this great lecture on Trade with ‘Simple and Exponential Moving Averages’ + application of ‘Fibonacci Retracements’. To this, I will be answering based on the professor’s task.
Theory (No images)
Define in your own words what are simple moving averages and exponential moving averages
Simple Moving Average
Simple moving averages are indicating tools found in the chart of a particular asset or cryptocurrency which is used in determining the price trend of a particular asset with reference to the period of time. It is always represented with a line with it variable colours depending on the settings of the indicator. This is one of the indicating tools mostly used by traders or investors to identify the price direction or movement of a particular asset as well as the resistance and support level of a particular asset.
Exponential Moving Average
Exponential moving average is also an indicating tool found in the market or price chart of a particular asset or cryptocurrency which is used in determining the recent price trend of a particular asset with reference to the period of time. Here, there is much concern to the time as it moves together with the price at a particular time. Just as the name implies, it takes into consideration the high or rapid rate of change caused by the sellers and buyers as per the time it occurred.
Explain how simple and exponential moving averages are calculated
How Simple moving averages are calculated
Simple moving average can be calculated by finding the sums of the closing price of a particular asset over a particular period of time.
Take for instance, in a paired asset like ADA/USDT using I hour chart, the closing price for the asset for the past 6 hours are: $45, $32, $26, $52, $43 and $20 respectively.
Here, the simple moving average will now be, the average of the closing price over the total period of time which is [45 + 32 + 26 + 52 + 43 + 20] ÷ [6] = 36.3333 (4 decimal places).
Therefore, the simple moving average of ADA/USDT will now be 36.3333 (4 decimal places).
How Exponential moving averages are calculated
The exponential moving average can be calculated by multiplying the recent (i.e today’s) closing price of an asset by the weighted average of gotten from the simple moving average and adding (summing) the answer together with the EMA that was gotten yesterday.
[Today’s price x weighted average of SMA] + [Yesterday’s EMA] = EMA (Exponential Moving Average)
Briefly describe at least 2 ways to use them in our trading operations
Both simple and exponential moving averages are used in determining and also identifying the trends of prices in the crypto chart.
They are used to indicate the existence of death or golden cross on a crypto chart which signifies the trader if the price of the asset is going up or down
They also can be used to predict a reversal in the trend movement of a particular asset. For instance, if a moving average line crosses the resistance line indicates a reversal in the bullish trend and vice versa.
They can also be used to identify over a period of time a barrier to the bullish or bearish movement of an asset in either case.
What is the difference between simple moving averages and exponential moving averages (Explain in Detail)
The key difference between simple moving average and exponential moving average is that exponential moving average shows a good sensitivity to the change in price since it deals with recent prices while simple moving average assigns equal weighting to all the values.
The exponential moving average is the weighted average of the recent while the simple moving average is the weighted average of all values.
The exponential moving average reacts to the changes in price faster while the simple moving average reacts to the changes in price slower.
The exponential moving average deals with the current data while the simple moving average deals with the average price.
Define and explain in your own words what “Fibonacci Retracements” are and what their gold ratios are
To explain this in a proper way, let’s look at a chart, you will see that assets prices do follow certain patterns. The asset will often trade in a tight range before moving to another range thus repeating the process. In this case, Fibonacci retracement is a technical tool used by traders which consists of horizontal lines and percentages drawn on a price chart to identify a good support or resistance zone thus for a better decision on when to open, close, apply stops and limit to their trade.
As the name implies, Fibonacci retracement, these are temporary dips that occurs on a straight line trend of an asset on a market chart. The pullbacks observed in a chart is what is known as Fibonacci retracement. This tool works on the mathematical principle of what is known as the Golden ratio. This tool works well in a trending market.
When there is a pullback or retracement at the support level when the market is trending up, this indicates a good buying time but when the retracement is at the resistance level when the market is trending down, it indicates a good selling time.
The Fibonacci retracement is a tools that consists of sequence of numbers, this sequence of numbers is what is used in measuring and also calculating the future pullback of an asset after a whim. How do we get the Fibonacci sequence, simply by adding the sequence of Fibonacci numbers starting from 0 to the next number 1 and so on. Example, 0 + 1 =1, 1 + 1 =2, 1 + 2 =3, 2 + 3 = 5, 3 + 5 = 8, 5 + 8 =13, 8 +13 = 21, 13 + 21 =34, etc. this is what is known as Fibonacci sequence.
Fibonacci retracement ratio can also be derived by dividing the previous number on the Fibonacci sequence by the next number. Example; on the sequence, we have: 0, 1, 1, 2, 3, 5, 8, 13, 21, 34, etc.
When you divide the first figure on the sequence which is 0 by the next digit which is one, this gives you a Fibonacci retracement ration as shown below:
0/1 = 0, 1/1 = 1, 1/2 = 0.5, 2/3 = 0.66, 3/5 = 0.6, 5/8 = 0.625, 8/13 = 0.615, 13/21 = 0.619, 21/34 = 0.618, etc.
The important Fibonacci ratio mostly used by traders are as follows:
38.2%, 50%, 61.8% and 76.8%, thus the Golden ratio is the 61.8% or 0.618 at the sequence of 21/34.
Practice (Only Use your own images)
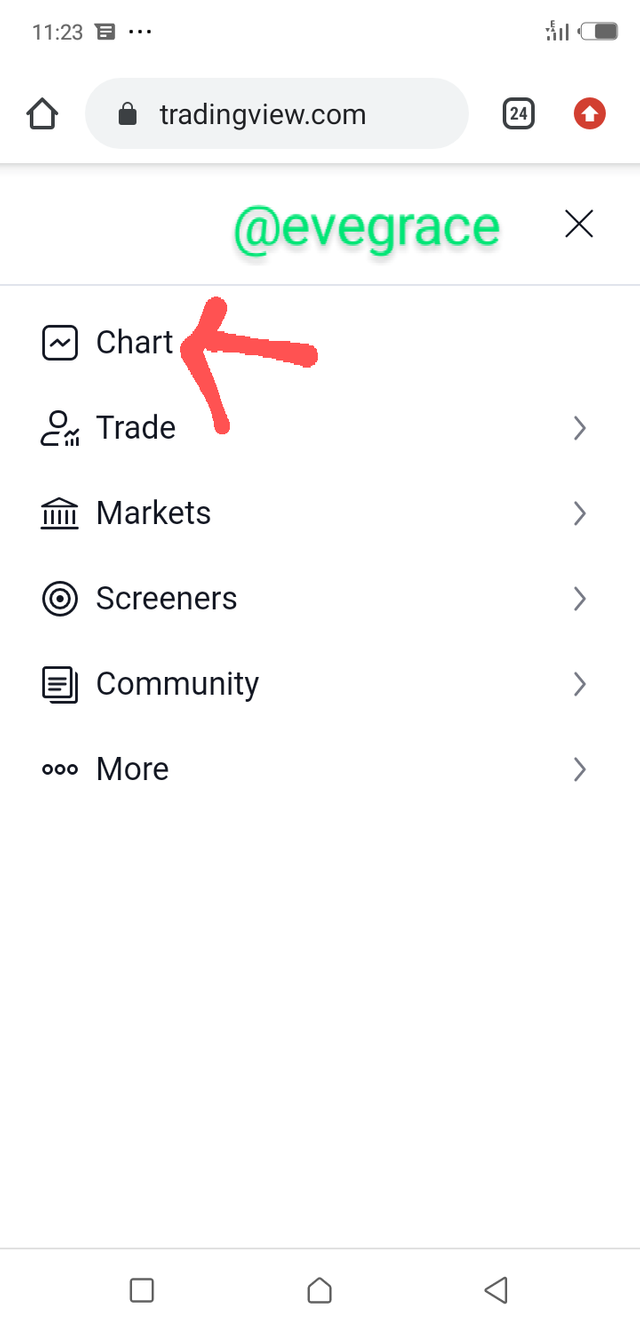
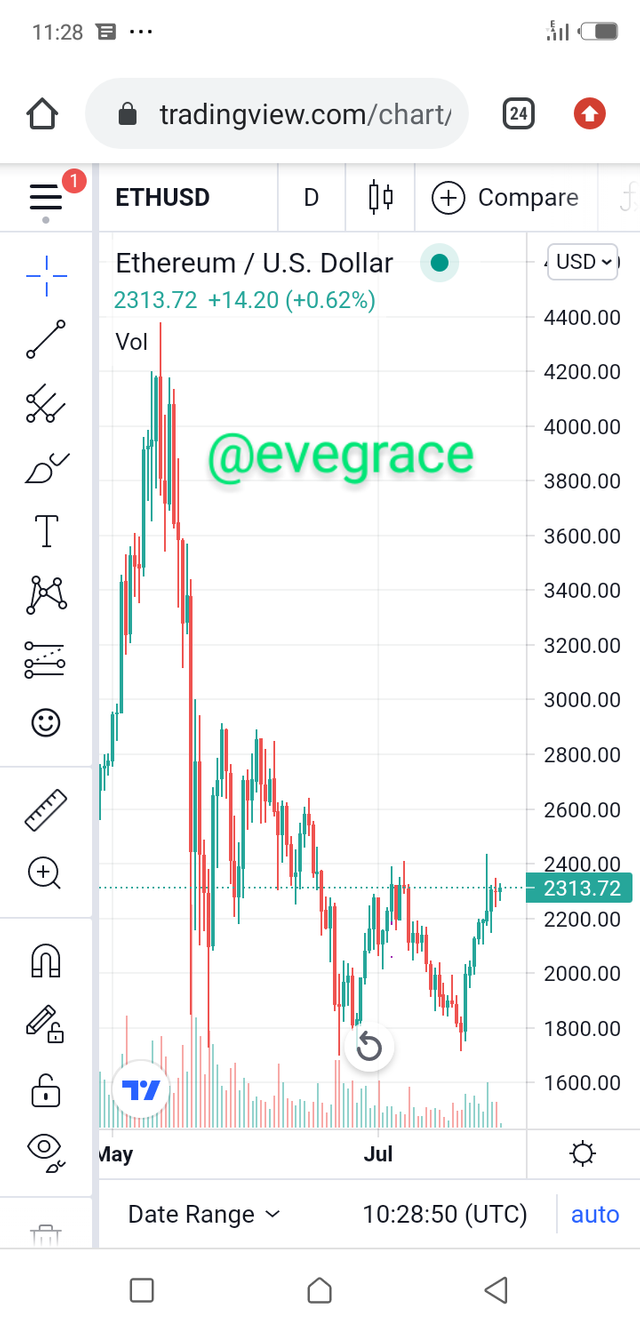
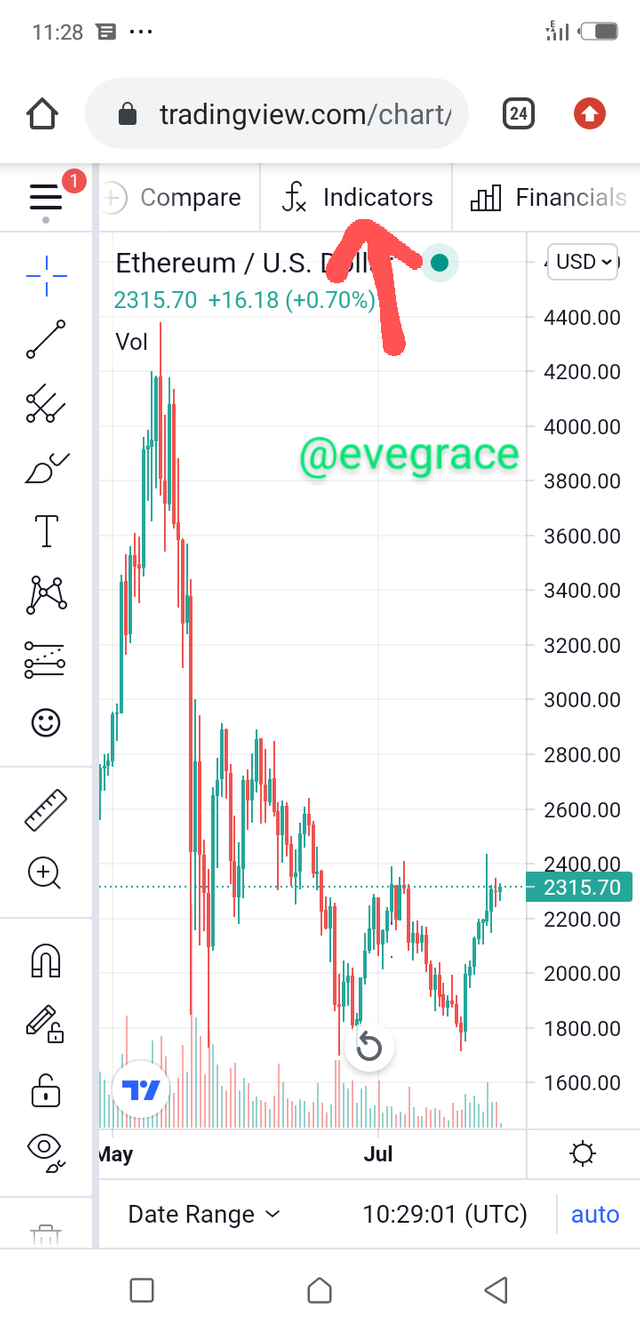
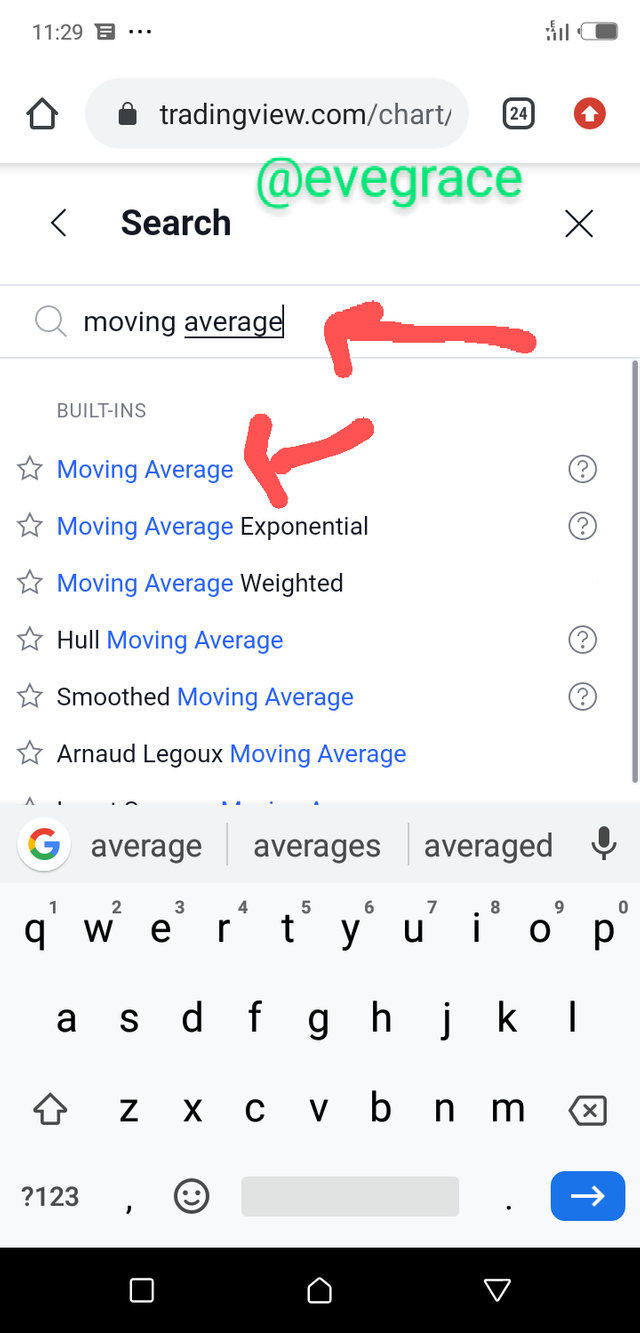
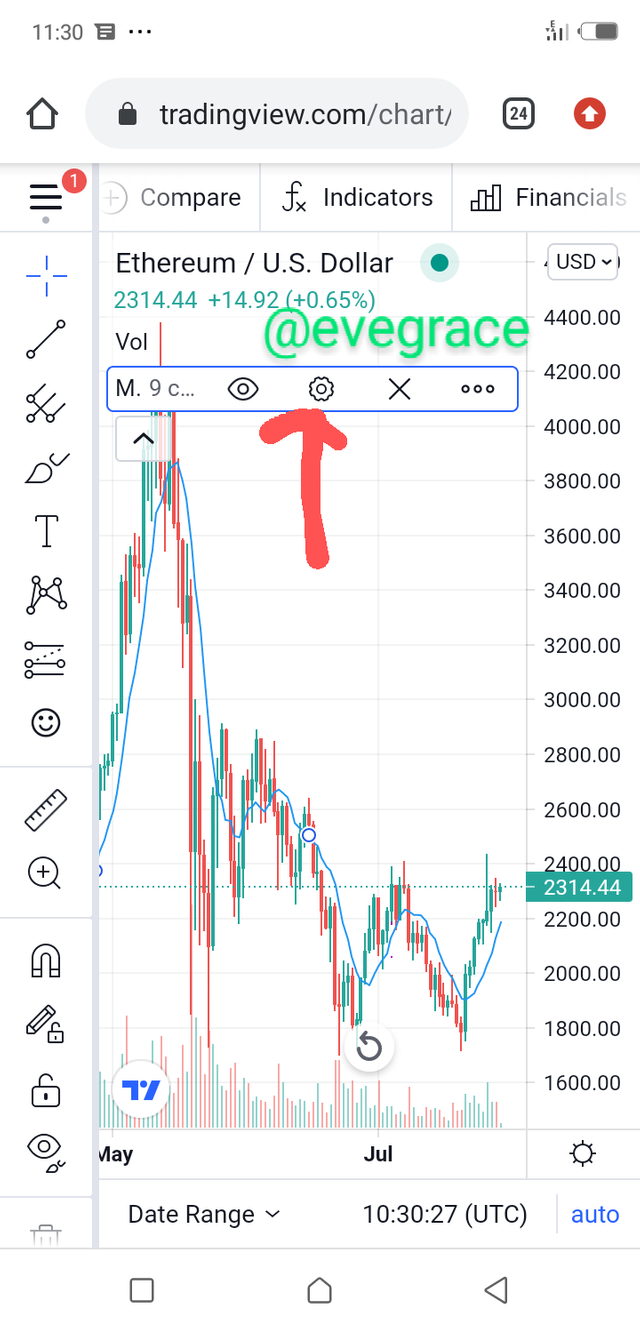
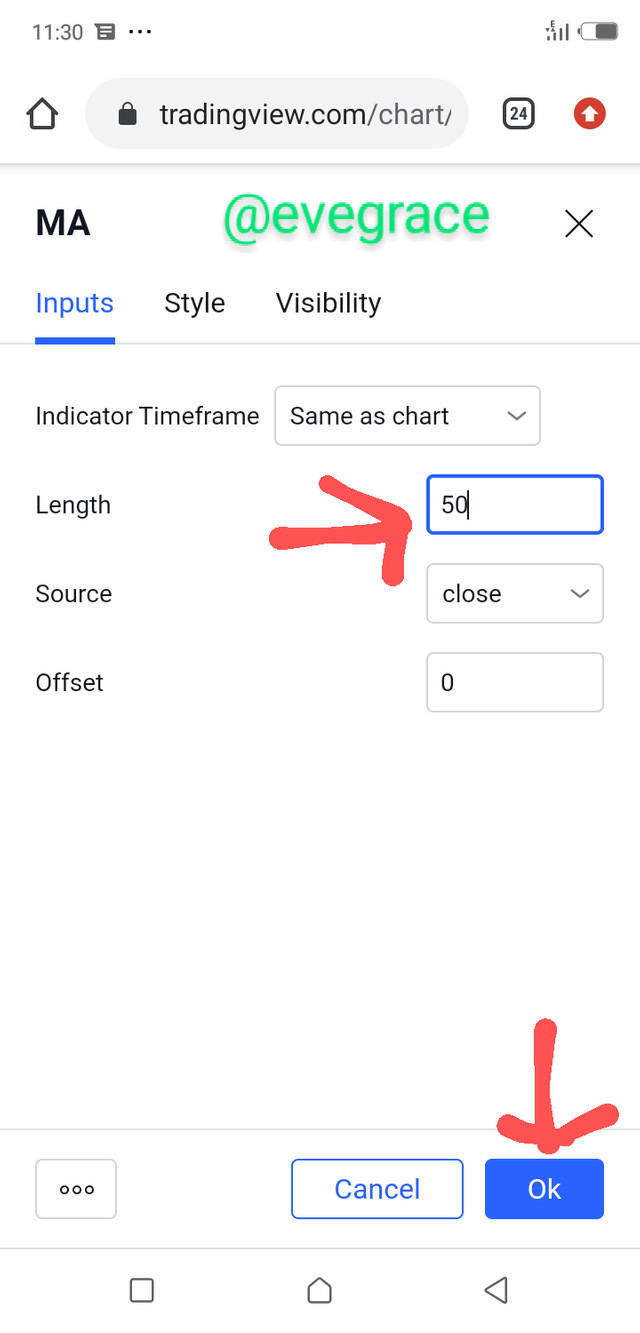
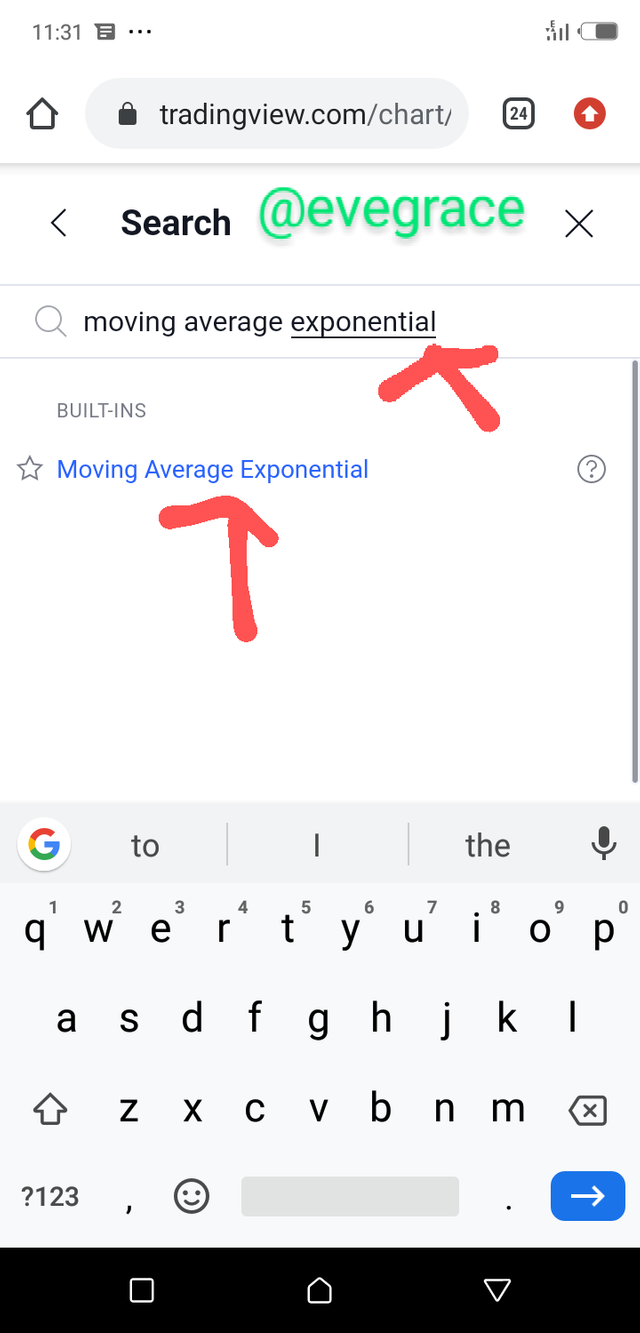
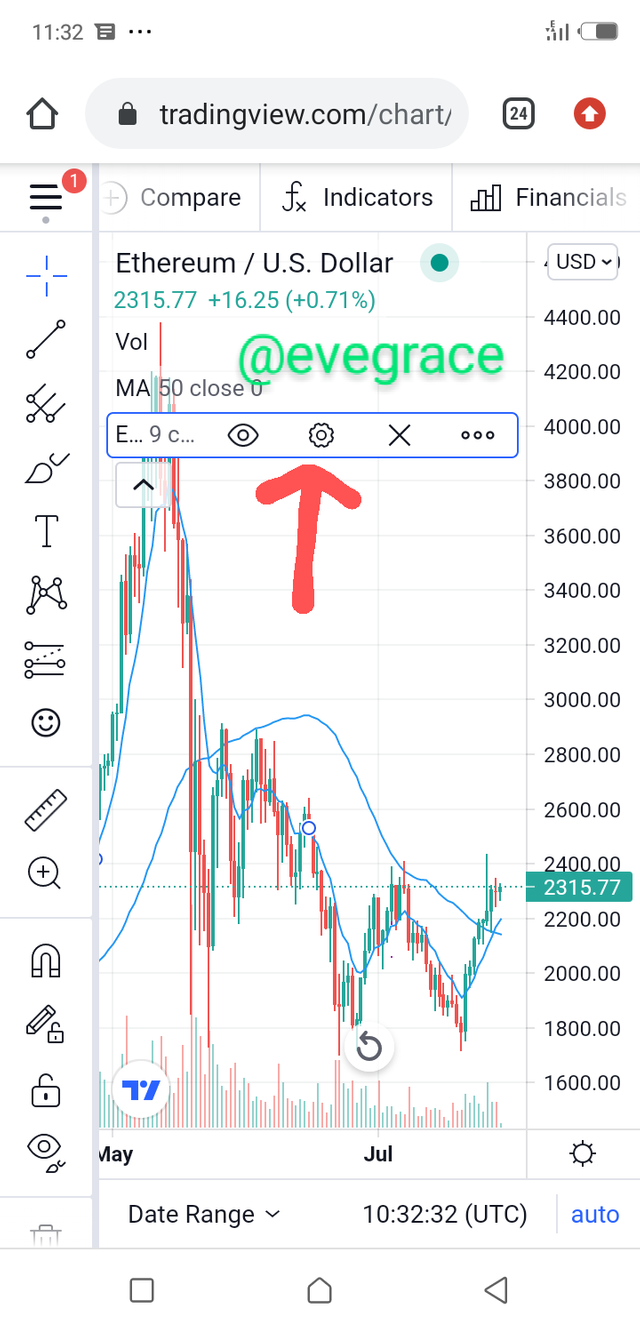
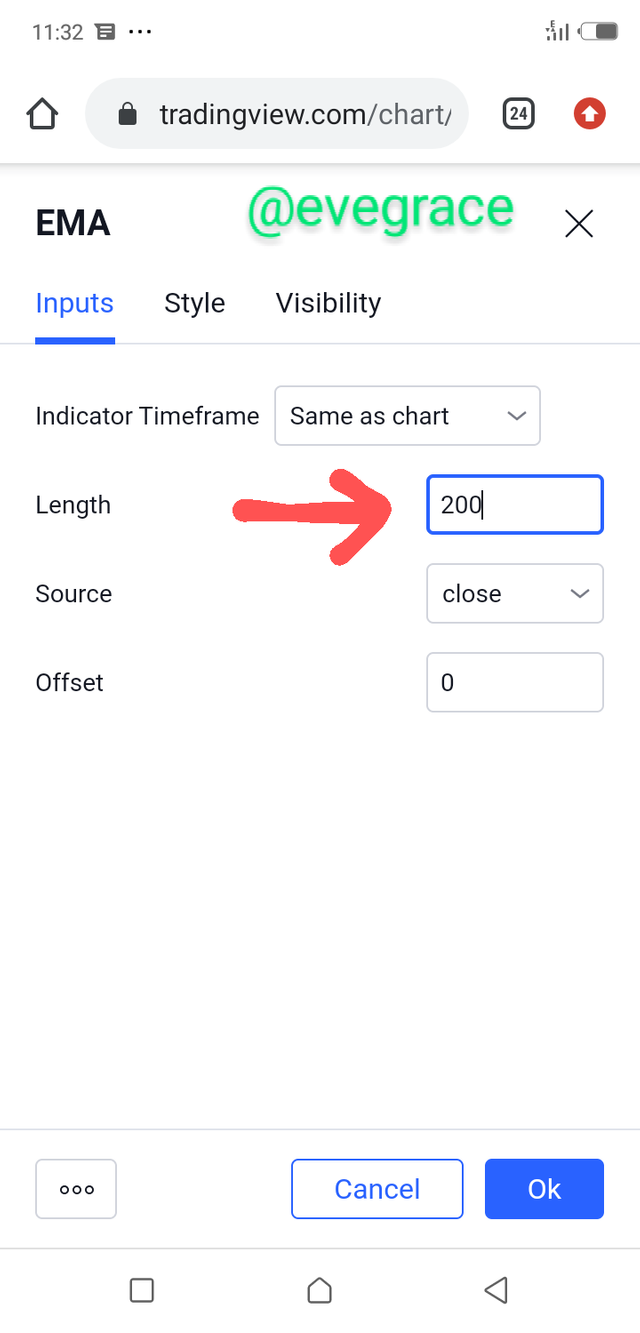
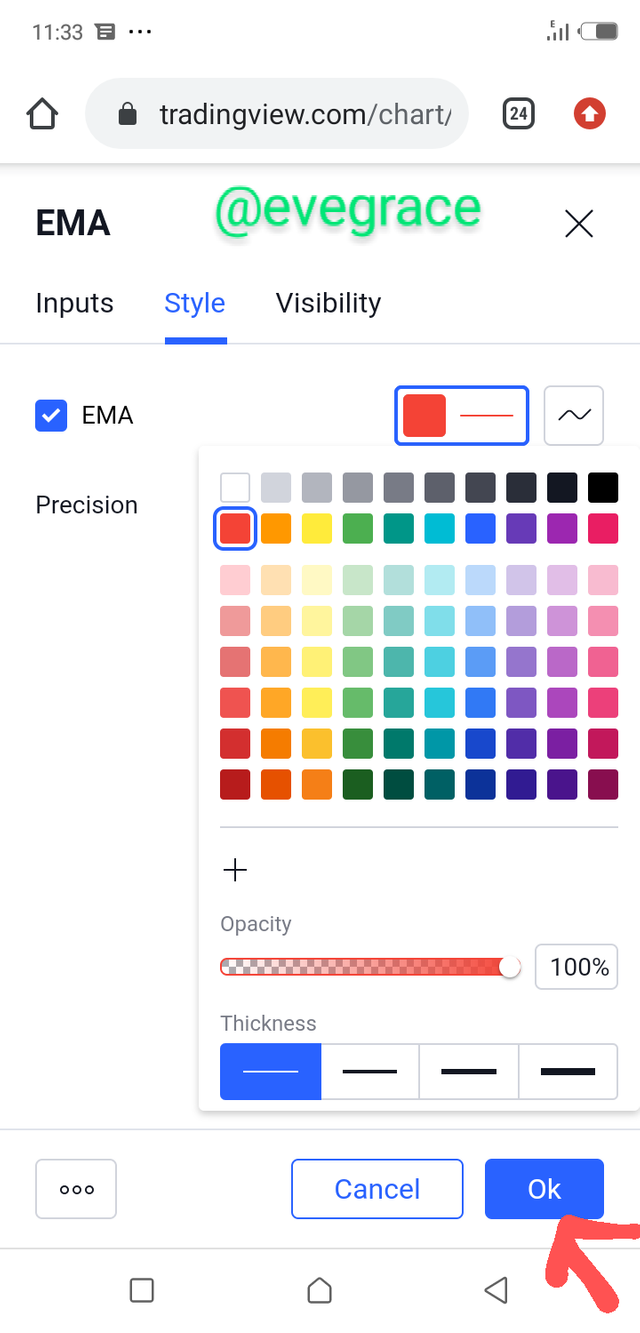
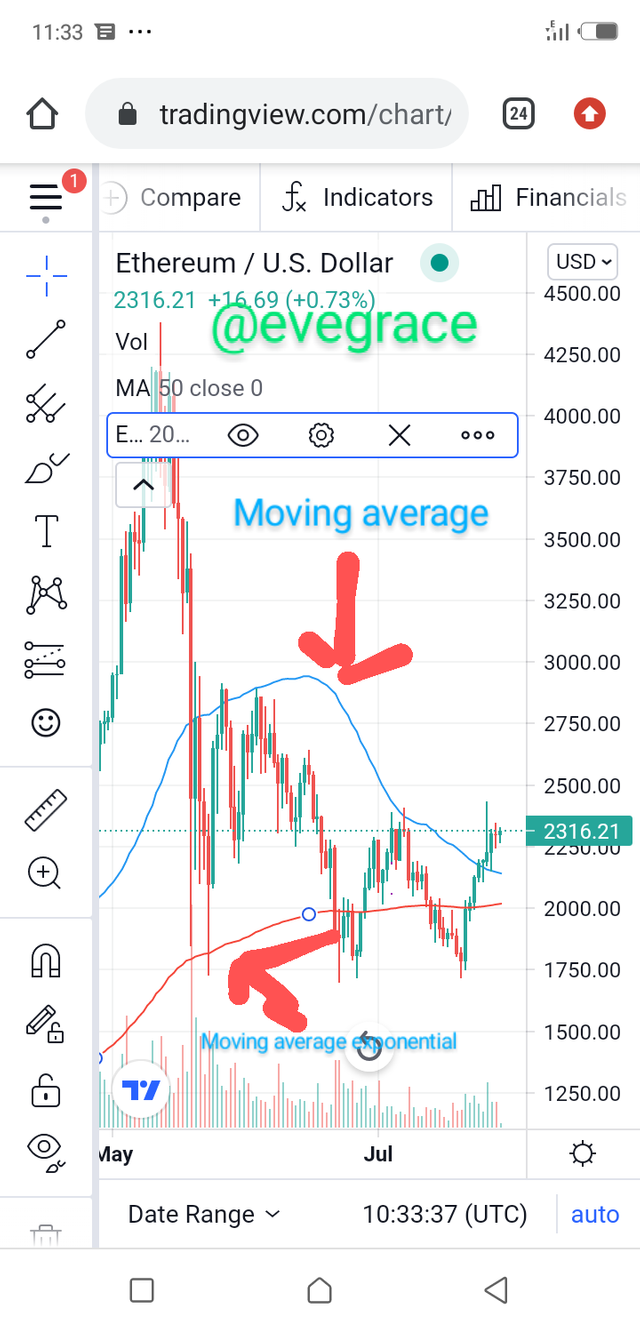
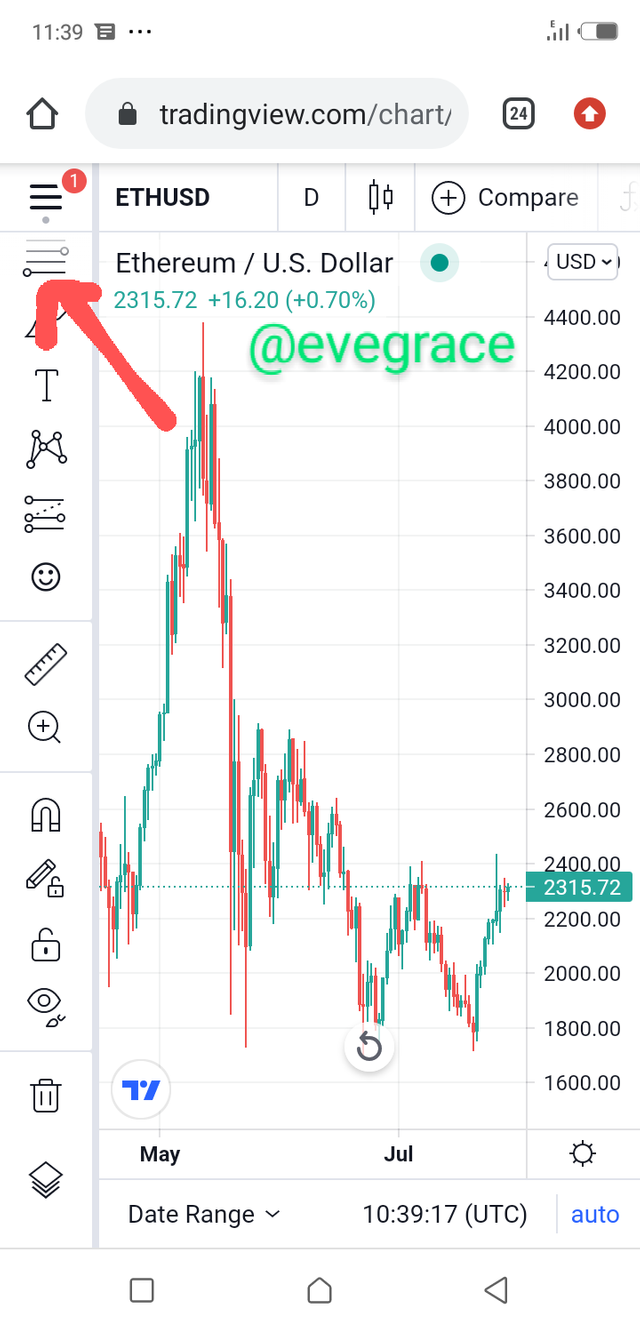
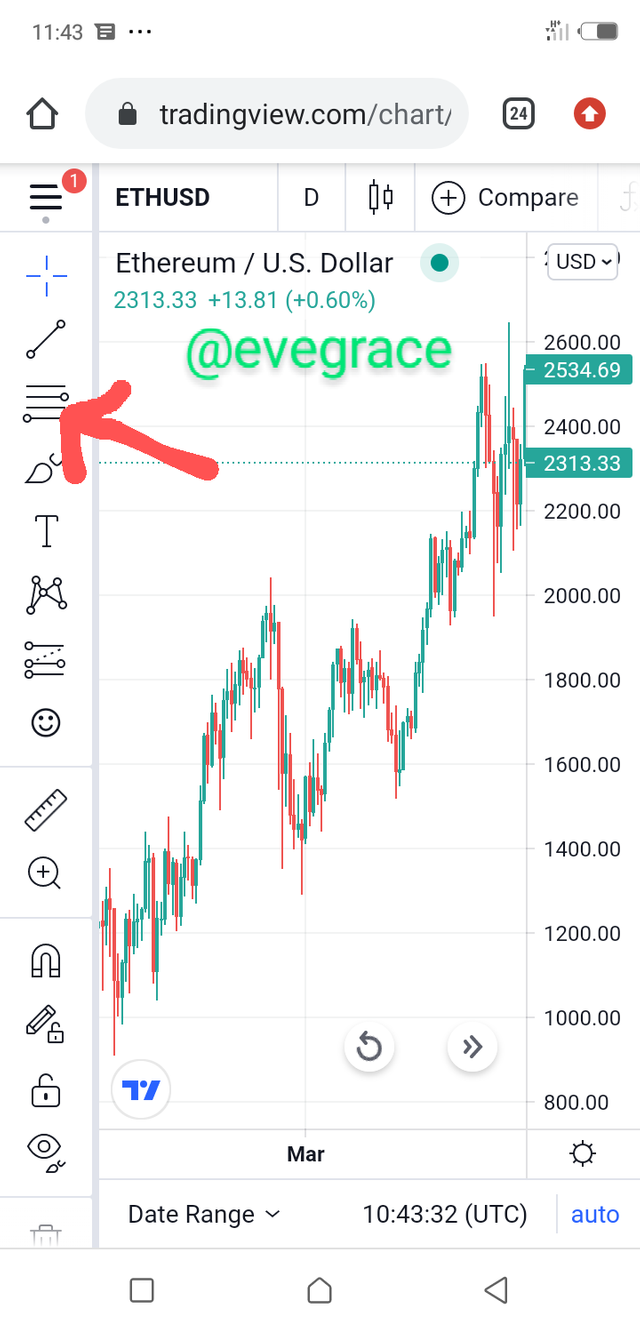
Show step by step how to add a “Simple and Exponential Moving Average” to the graph (Only your own screenshots – Nothing taken from the web)
visit https://tradingview.com/
Then follow the steps below

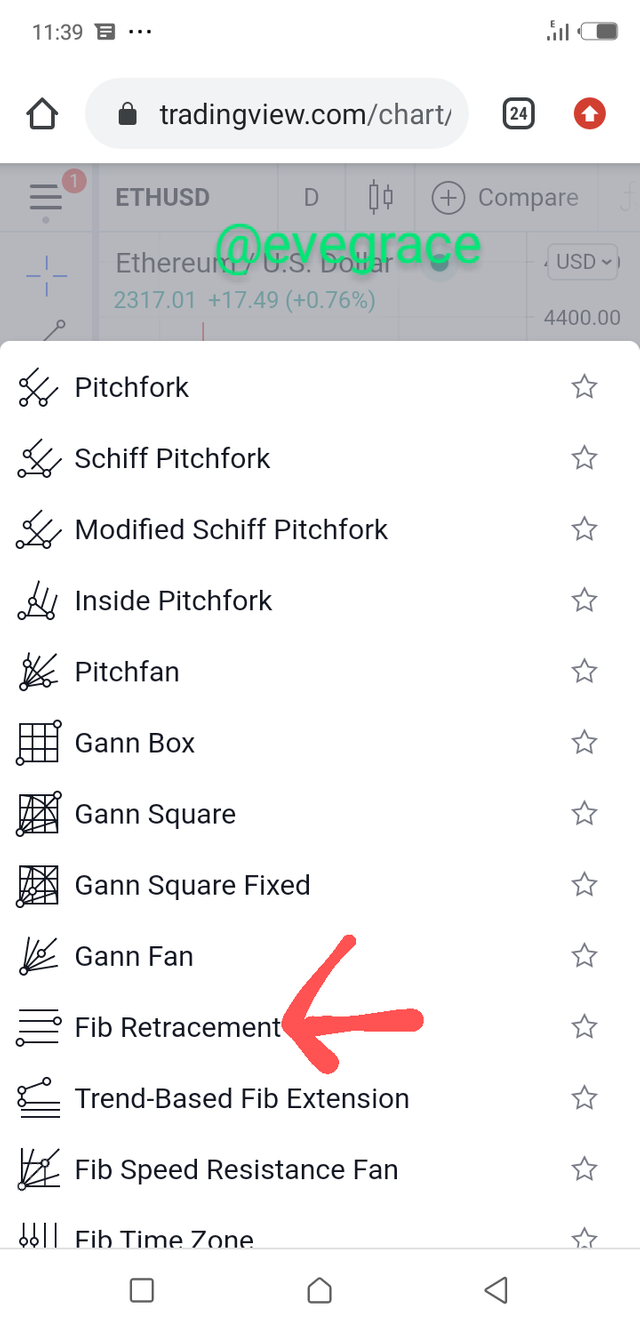
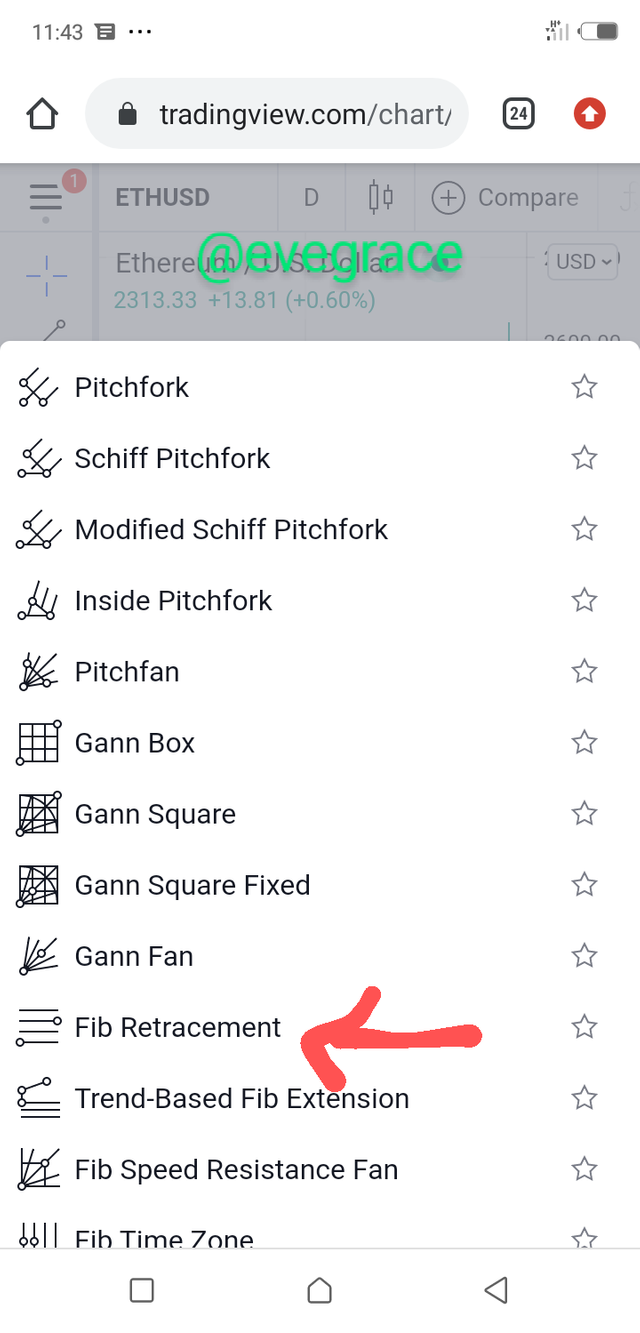
Use “Fibonacci Retracements” to chart a bullish and bearish move (Own screenshots only – Nothing taken from the web)
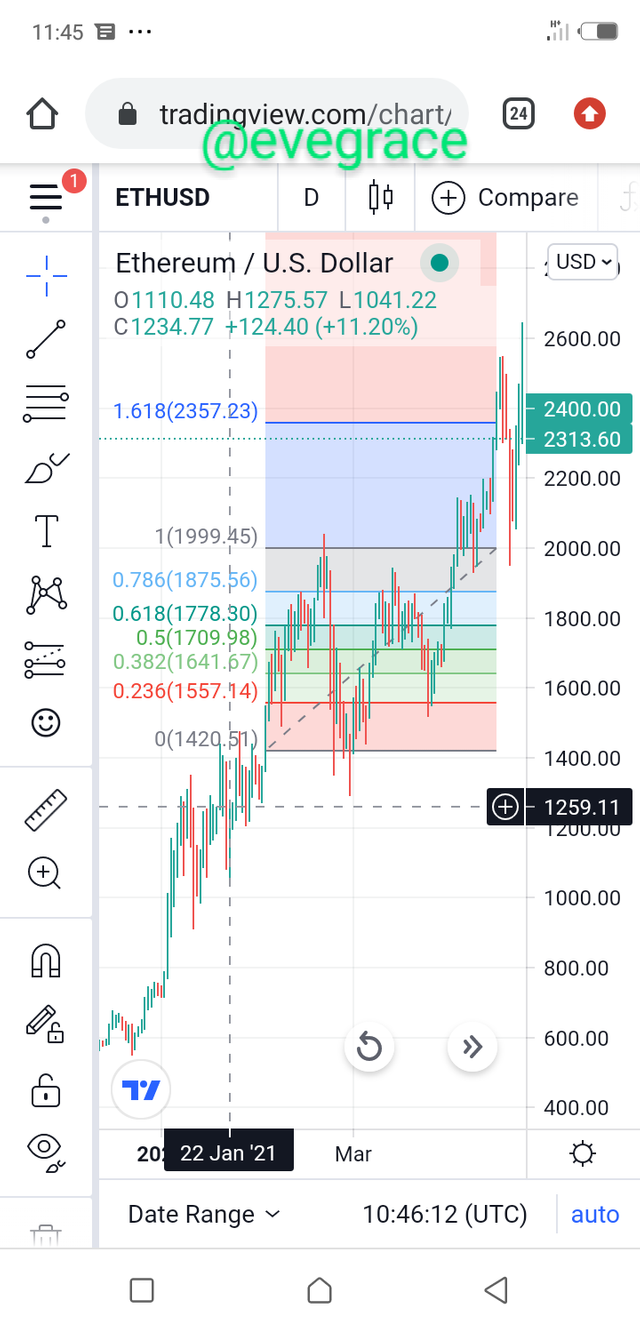
The chart below shows a bearish Fibonacci retracement move

The chart below shows a a bullish Fibonacci retracement move
Conclusion
Moving averages are one of the most popular tools or indicators which traders depend on when trading to understand the market movement of prices of assets. This averages serves as indicators to help traders know when to open a trade, close a trade and also apply stops and limits to their trade.
Thanks Prof @lenonmc21 for this wonderful and interesting lecture, have learnt a lot during the course of this study.