Crypto Academy / Season 3 / Week 5 - Homework Post for @kouba01
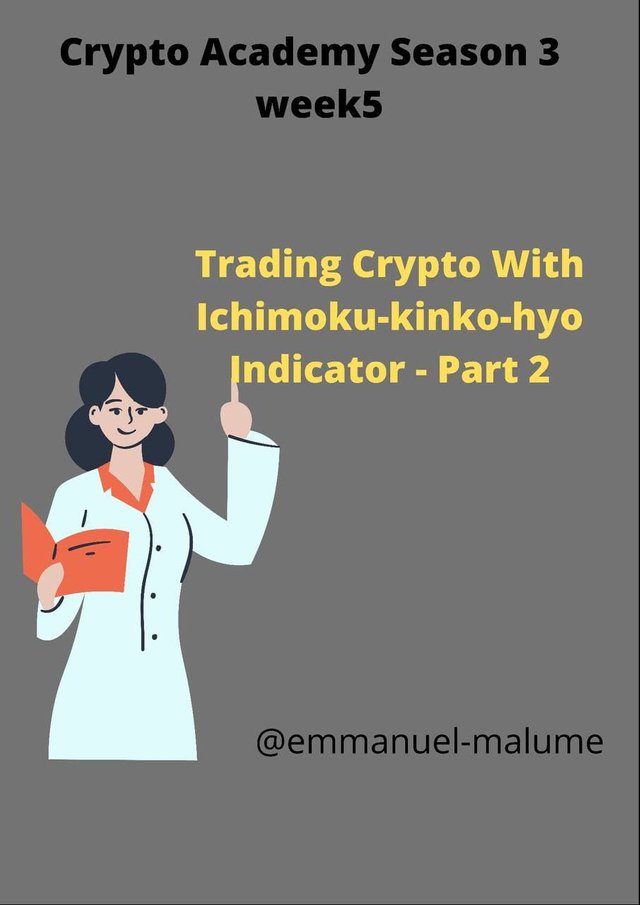
There are several trend indicators and also support and resistance indicators but quite a few indicators can do these functions alone and effectively and one of them is the Ichimoku Kinko hyu

1. Discuss your understanding of Kumo, as well as its two lines. (Screenshot required)
The Ichimoku kyu indicator is made up of 6 key components : teken-sen, kijun-sen, kyu-sen, senkou-sen,senkou-span A , senkou-span B and the Kumo cloud . In this questions, we will be talking about the Kumo clouds
The Kumo cloud is a key component of the Ichimoku indicator and one of the easiest to see when we look at the indicator on a chart which gives a lot of information about the direction of the market based on its orientation, the momentum of the market based on its thickness and whether a trend reversal is about to occur or not
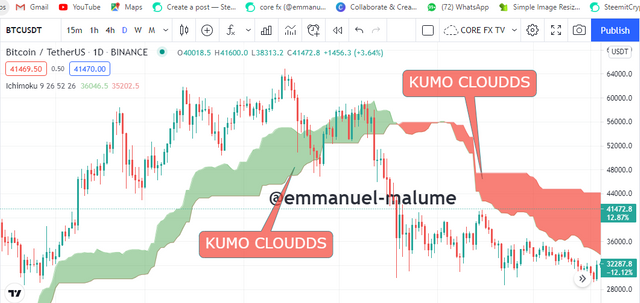
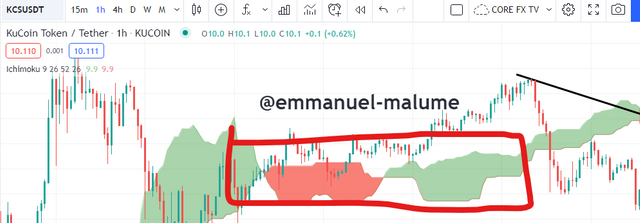
Kumo cloud is actually formed from the space between senkou-span A(SSA) and senkou-span B(SSB). It means that the cloud is bounded by SSA and SSB. The default cloud setting has this unique green color when the SSA is above SSB and red when SSN is above SSA
The orientation or direction at which the cloud is moving helps with the following :
1.Uptrend: when we see the cloud clearly moving in an upward direction with the SSA above SSB we can confirm an uptrend and like I said the cloud is colored green by default
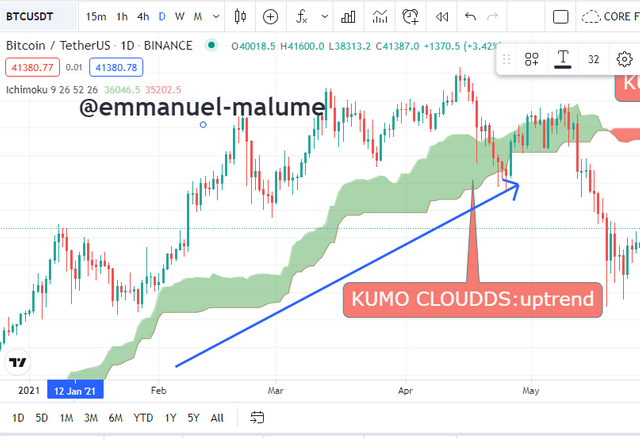
In the btcusdt chart above, we can see that the cloud was having an upward orientation and direction and the price of the asset was rising
2.Downtrend: when we see the cloud moving downwards and the SSB is above the SSA we can clearly identify a downtrend with the cloud often red in color
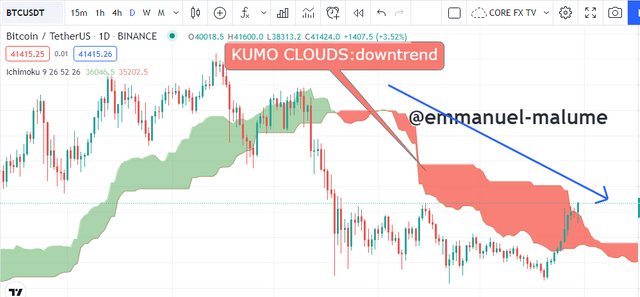
In the btcusdt chart, the cloud orientation or direction moving downwards and we saw price keep moving downwards
3.Ranging or neutral market- here we see a flat cloud that is neither moving up or down note that in this cloud state, the position of SSA and SSB doesn’t matter and is often seen after a market twist
Now let’s talk about the lines that bound the cloud
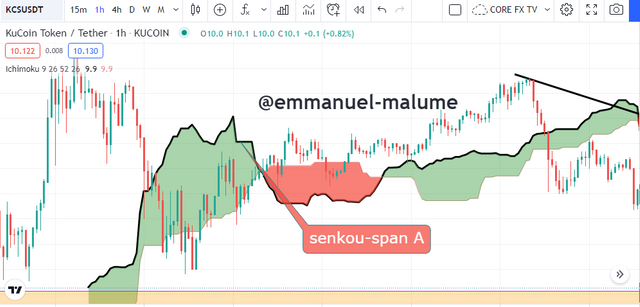
1.Senior-span A: this is derived from the other two components of the Ichimoku indicator which are the teken sen and kijun sen by calculating their average and then plotting the average 26 periods ahead. It is known as the leading span and forms the upper boundary of the cloud when it's trending up and the lower boundary when its trending downward and can serve as either a support or resistance area
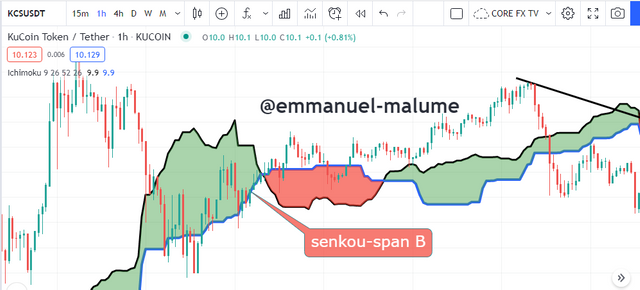
Senkou- span B: the second line bounding the Kumo cloud and the slower of the two lines. This is gotten from the summation of the highs and lows over the last 52 periods and plotting it 26 periods ahead. It forms the lower boundary of the Kumo cloud when in an uptrend and the upper boundary when in a downtrend
2. What is the relationship between this cloud and the price movement? And how do you determine resistance and support levels using Kumo? (Screenshot required)
The Kumo cloud orientation helps in showing the direction of price movement(trend). When the cloud is moving upwards and is below the price we can say the price is in an uptrend and if the above price and the cloud has a downward direction we can confirm a downtrend for the market.
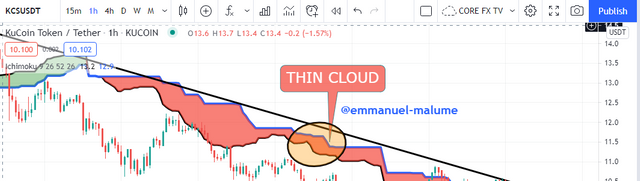
The Ichimoku cloud as much as it identifies trends in the market also shows how volatile the market is or the momentum in the market currently. This is shown by the thickness or thinness of the cloud itself. When I talk about thinness or thickness I mean how wide the space between the two lines is.
Thin clouds: here the space between the cloud is not much and this cloud often leads to trend reversal cause when they appear they represent weakness of the cloud as support and resistance area for price to react from and when this is combined with other components of the Ichimoku indicator we get a good signal
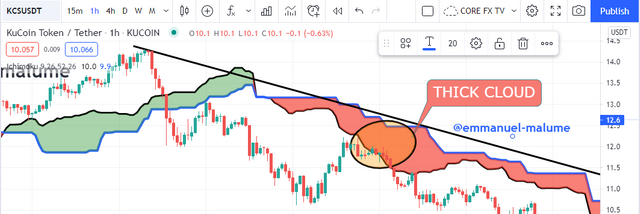
Thick clouds.: the space between the SSA and SSB is much and this represents that the cloud is strong support and resistance area through which price can’t penetrate through and that the market is very Volatile and the momentum is high

Resistance and support by the Kumo clouds
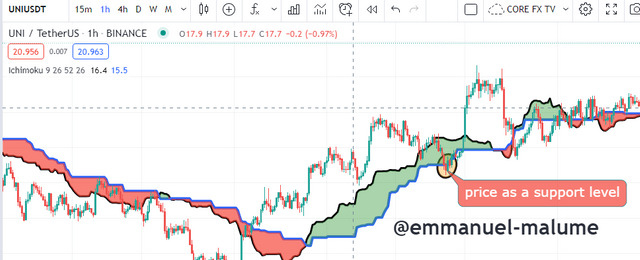
When the price is moving in an uptrend, we often see the cloud act as a support level for price from which price bounces off to continue its uptrend
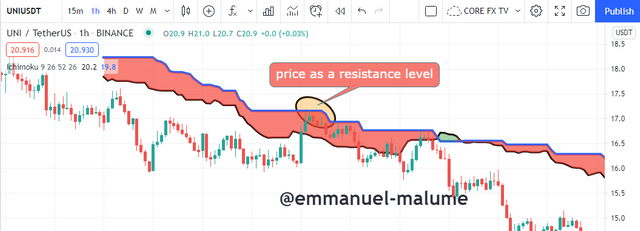
When the price is moving in a downtrend, we see the cloud act as a resistance level for price to retrace to and then bounce back to continue moving downwards
Sometimes price tends to enter the cloud which may not be moving either upwards or downwards. I am referring to a flat cloud here and once this happens we see the two boundaries of the cloud acting as strong support and resistance levels with price respecting them well. It doesn’t work like the traditional horizontal support and resistance levels that is fixed
How does the Kumo clouds compare to the traditional support and resistance levels?
The horizontal support and resistance levels are fixed areas and in a straight line limiting its action showing where the market can’t probably reject from and we can see this when trading , we are looking at a key horizontal level but suddenly price reaches a particular level and starts rejecting fromthere and we ask why? Someone using the Ichimoku would see where the cloud has formed and shows him potential reversal arewa due to support and resistance and he or she is ready for such actions
Example:
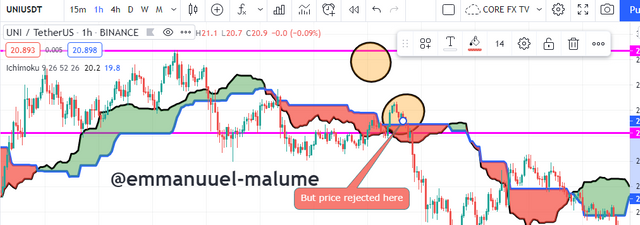
Below is the uniusdt chart, with the traditional horizontal support and resistance, one would expect the price to retrace back to the point marked below
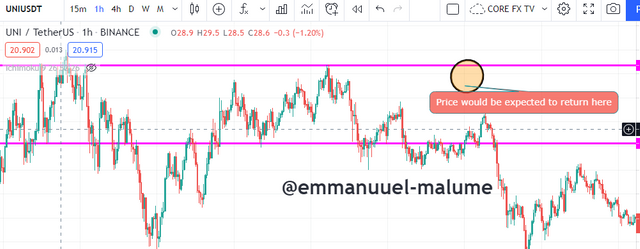
but someone using the Ichimoku would see the resistance in front of price as we can see below
3.How and why is the twist formed? And once we've "seen" the twist, how do we use it in our trading? (Screenshot required)
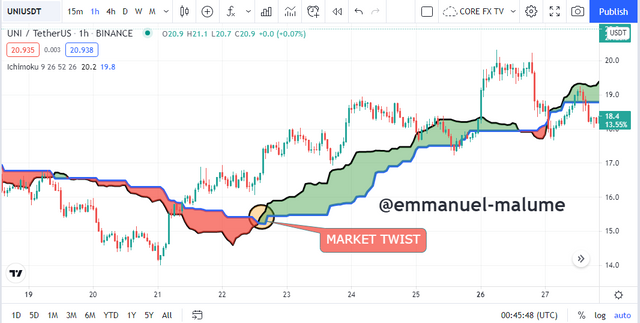
The senkou-span A can actually cross the senkou-spanB to move downwards or upwards and when this happens we call it a cloud twist. It is like the golden crosses. Between moving averages but in this situation a cross between SSA and SSB doesn’t confirm a trend reversal on its own , the market actually enters a range phase first . To confirm a market reversal a lot of conditions have to be met first to start with
The crossing over or twist occurs due to loss of strength in the current market trend and the cloud starts getting thinner at first showing weakness and then if there is no influx of new buyers if it’s an uptrend or sellers for a downtrend, we see the market undergoing a twist and we get a flat cloud first before the market continues ina new direction or continued the old trend
We said earlier that the Ichimoku being a trend indicator but how do we confirm a trend in the market, we cant use the Kumo cloud alone rather we need certain conditions to be met first and they are the following
BULLISH TREND
for a bullish trend we need the senkou span A to be above the senkou span B and then the cloud movement should be in an upward direction and also a thick cloud . We also need the chikou span to be above the cloud too
BEARISH TREND
For a bearish trend or downtrend to be confirmed we need the senkou span B above the senkou spanA and the orientation or direction of the cloud is moving clearly downwards and also a thick cloud too.
Neutral trend
The neutral trend or range is confirmed when the market is flat like I said the position of the SSA and SSB doesn’t matter
How to identify trend reversals
To confirm a market reversal we need to look at 4 things. They are :
1.A twist must occur: The SSB and SSA needs to cross each other to confirm a market reversal but this doesn’t confirm a market reversal on its own tho
2.Price must break through Kumo cloud: price must break through the link cloud from its earlier direction, if it was in an uptrend it needs to break through the kumo cloud downwards and if it’s in a downtrend
3.The chikou span must cross the cloud too to the new trend
4.The direction or orientation of the cloud has to change from the old trend direction to the new trend direction with the senkou span B needing to move in that new direction
5. Explain the trading strategy using the cloud and the chikou span together. (Screenshot required)
The chikou span is the correct opposite of the kumo cloud in the sense that the cloud plots ahead of price the chikou span is behind the price and so is a lagging indicator. The two indicators work hand in hand to make the Ichimoku a good trading indicator. It is the cross of the chikou span line over the kino cloud in any direction that clears confirms a trend change
BUY POSITION
The Kumo cloud Orientation has to be in an upward direction with the SSAanove the SSB and then the chikou span should cross the Kumo cloud upwards. This confirms a clear bullish market and then we can now wait for a retracement of price towards the cloud to enter so we can buy lower for maximum profit and smaller risk . Also, we should have a thick cloud too
SELL POSITION
firstly, the kumo cloud has to be moving in a clear downtrend with SSB above SSA and then we wait for chikou span to cross the cloud in the upward direction and we have a confirmed change in market direction and then we can enter a sell position . Like the sell trade I advise we wait for a retracement of price towards the cloud then we enter at a discount
6. Explain the use of the Ichimoku indicator for the scalping trading strategy. (Screenshot required)
Scalping is the process of trading small price movements to get large profits by increasing the risk to reward . We can use the Ichimoku indicator for this process too. In scalping, we don’t use higher time frames we use smaller time frames cause all we need is just small market moves.
In the example, I will be giving let us use the 15m time frame
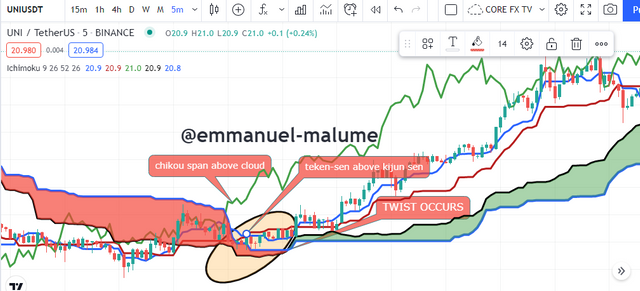
Conditions for uptrend
1.kumo cloud must be moving in an upward direction
2.SSA above SSB
3.chikou span has crossed the cloud to be above
4.Teken sen is above kijun sen
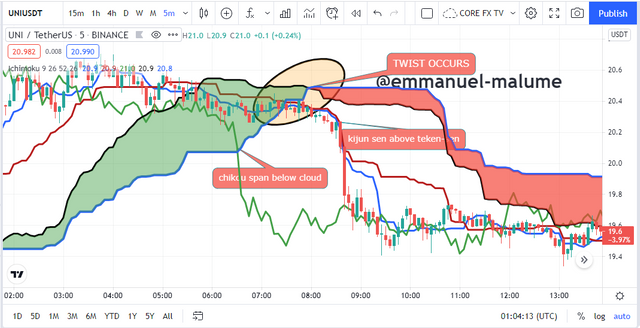
For a downtrend
- Kumo cloud must have a clear downtrend orientation
2.SSB is above SSA
3.chikou span has crossed and is now below the clouds
4.kijunsen is above teken sen

This class has clearly shown how good of an indicator the Ichimoku kyu indicator can be and it’s various component especially the kumo cloud is which acts as a both a support and resistance level and helps in identifying trends and trend reversals and also tell us about how volatile the market is.
We also talked about the chikou span and how when combined with the Kumo cloud is good for taking trades for buy and sell position and finally, we talked about scalping
Thank you @koubal for this nice lecture
Hello @emmanuel-malume,
Thank you for participating in the 5th Week Crypto Course in its third season and for your efforts to complete the suggested tasks, you deserve a 7/10 rating, according to the following scale:
My review :
Good content article in which you covered the topic in all its aspects where the answers were clear. I have some notes:
You interpreted well the KUMO cloud and its two lines, providing an organized and clear set of information.
Your interpretation of trading using the twist technique was not clear and did not address all possible cases.
Thanks again for your effort, and we look forward to reading your next work.
Sincerely,@kouba01
Thank you professor