Steemit Crypto Academy | Season 2: The Swing Trading Style | Homework task for @yohan2on
Hello All Steemians !!!
Today I'm going to make my Steemit Crypto Academy Homework task by professor @yohan2on that talking about The Swing Trading Style. Very interesting lessons. Actually I have very little knowledge about this, but I will try to discuss it to improve my writing skills. On this occasion I will try to discuss it following 5 points.
Trading
Everyone who is involved in the world of cryptocurrency knows trading. This is one of the important points traders take to increase investment capital and generate profits. Trading in the cryptocurrency world is carried out by processing crypto pairs transactions that are available on exchange platforms in the market. It can be said that trading is an exchange of crypto assets that are processed for certain purposes.
Trading in the cryptocurrency world requires a strategy and understanding of the crypto assets involved. Traders before carrying out the process of buying and selling need a technical and fundamental analysis. This is an important factor to take to read charts and understand market trends and demands. All information and data including prices, charts, volume, market cap, and others must be analyzed properly for successful cryptocurrency trading.
Swing Trading
Swing Trading is a way for traders to get short to medium term profits. The time required can be hours, weeks, and months. All of this is done to achieve the targets that have been prepared. Traders usually perform technical analysis by reading price charts from time to time. Traders will determine the right moment to enter and exit the transaction process that will run. Timing and the right decision is the key in carrying out swing trading. All the related about trading and crypto assets must have been carefully planned by the trader to get profit and minimize losses.
Trading plan SBD/USD
Trading plan is a neat and planned record created by a trader based on the strategies needed to make the trading process successful. The main points that must be considered are the trading system, risk management, time management, and trading rules. In this case the planning of the question of what, when, why, and how to process crypto asset transactions must be clearly written and run properly. This aims to bring in profits and minimize losses. And also the risks that may occur can also be overcome.
Here I will make a trading plan for SBD/USD. Technical analysis which is an understanding of the SBD/USD chart in https://www.tradingview.com is very useful and helpful. The form of a chart that shows an uptrend and downtrend can be a reference. In the initial period of an uptrend I will start entry to get profit and prevent losses. The observable support and resistance lines will also help determine the take profit and stop loss values. Reverse strategy that uses both the bullish and bearish phases of the market as a major factor can also help in determining when to buy and sell crypto assets.
Multiple Time Frame Analysis
In carrying out technical analysis, reading charts requires different time frames. Here I use weekly, daily, and the 4 hours trading time difference. This is necessary because it will make easier traders analyze over a long period of time using a large time frame. and vice versa in a short time using a small time frame.
Weekly time-frame chart
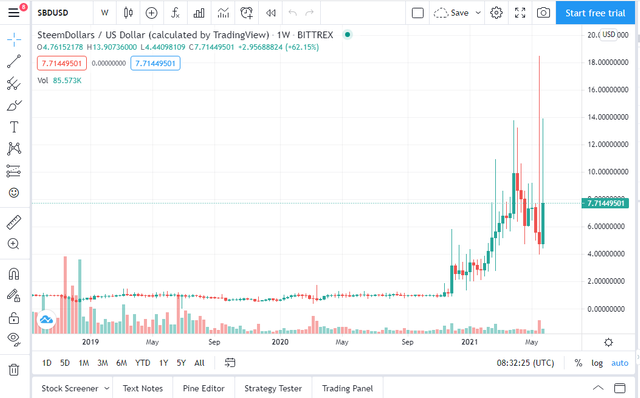
I will use a weekly time-frame chart to see how SBD/USD price changes each week. This will help me in analyzing a long time view and knowing its history. On the last candle or this week SBD/USD price has risen after the previous 2 candles or 2 weeks ago fell.
Daily time-frame chart
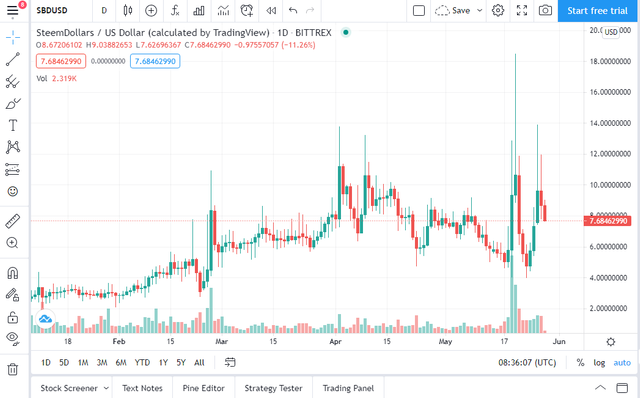
I will use a daily time-frame chart to see SBD/USD price changes every day. This will help me in analyzing intermediate time view and knowing the uptrend or downtrend in the market. On the last 2 candles or within 2 days SBD/USD price has fallen after the previous 3 candles or 3 days ago went up.
4 hours timeframe chart
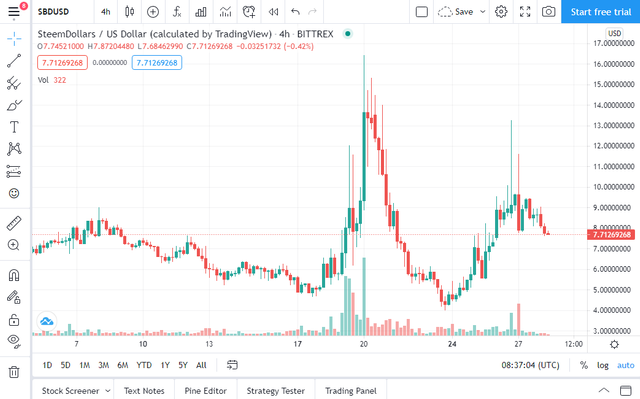
I will use a 4 hour time-frame chart to see SBD/USD price changes every 4 hours. This will help me in analyzing a short time view and find out that price volatility is rising and falling. In the last 3 candles or in 12 hours SBD/USD price has fallen after the previous 2 candles or 20 hours ago went up.
Candlestick analysis and use of other relevant supporting indicators for your trade decision
In carrying out technical analysis, it is certain that the main concern is chart patterns. Chart readings and market trends are very influential. Traders have to prepare and analyze all the data included in the chart such as uptrend & downtrend, support & resistance lines, bullish & bearish phases etc.
On the weekly chart, I take advantage of it to see all-time highs and all-time lows of SBD/USD prices. This chart allows me to see a broader view of the market.
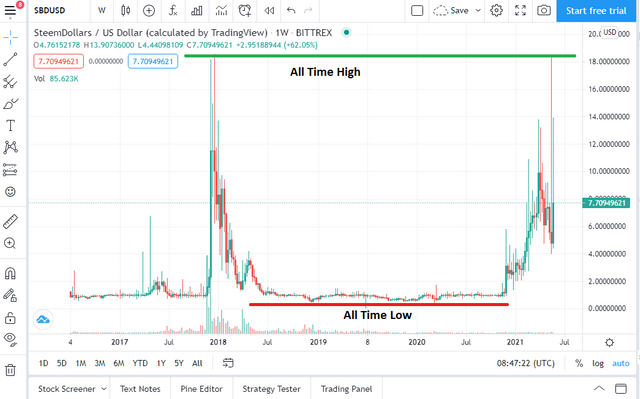
According to the chart, all-time highs of SBD/USD price is $18.3922 on May 17 2021. And all-time lows of SB /BTC price is $0.4016 on March 9 2020. This is a very distant and significant change in price.
On the daily chart, I take advantage of it to see the uptrend and downtrend in the market of SBD/USD prices. This chart allows me to see a view of changing market trends over a period of time. Uptrends and downtrends can occur in the daily to weekly time.
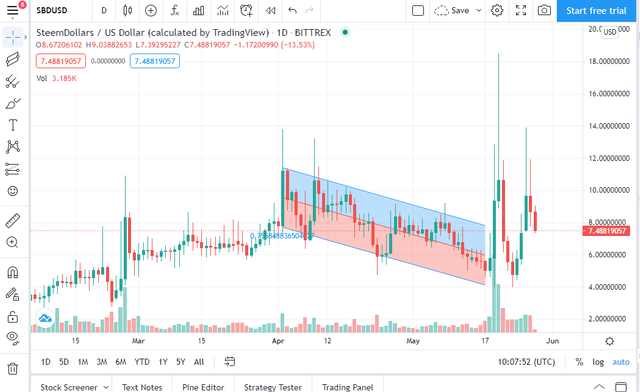
According to chart, Uptrend and downtrend always occur in the market within 3-8 days. On the sign I gave on the chart, on April 2 2021 SBD/USD price is $11.2820. And on May 17 2021 SBD/USD price is $4.6358 and has reached the time or the last day of the downtrend. Within that 1.5 month period, there were many insignificant uptrends and downtrends. some lasted for only 3 days and some for 8 days.
On the 4-hour chart, I take advantage of it to see patterns in the form of swings and also down triangles on the SBD/USD price market. This chart allows me to have an indication of when the price goes up and down based on a short period of time or 4 hours.
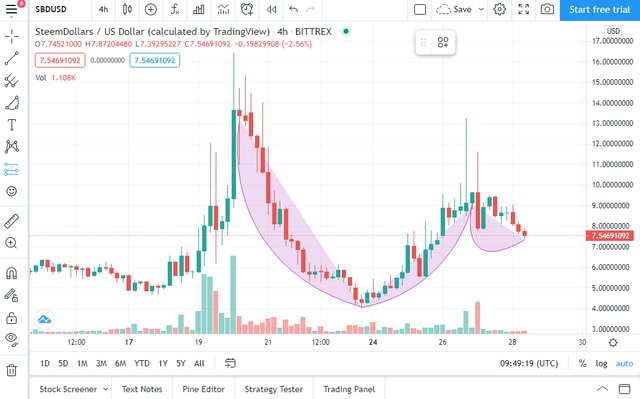
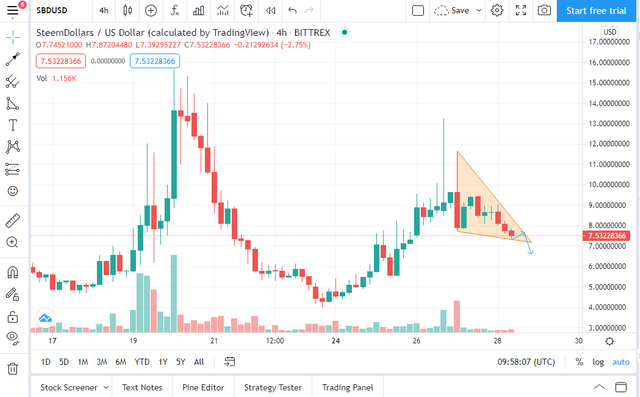
According to the chart, I can tell that a bullish phase (up) definitely followed by a bearish phase (down) with a different timeframe. The 2 patterns above are very useful for predicting SBD/USD prices in a short time so you can immediately make the right decision. Where the last 3 candles or within 9 hours SBD/USD price was down around $7.5322. My prediction is this price will continue to fall for the next 24 hours.
Trade management ( Setting stop loss, trailing stop and take profit)
In this trade I will wait and be patient. I will entry the trade at $8.7136, will take profit at two points, $9,6994 and $11.6411. I will be stopping the loss at $6.4134. These points are resistance points that are very likely to occur and come back because they are not very significant. Stop loss is at a suitable support point and is not far below the entry price.
| Entry Price | 8.7136 |
|---|---|
| Stop-Loss | 6.4134 |
| Take Profit 1 | 9,6994 |
| Take Profit 2 | 11.6411 |
Conclusion
Every cryptocurrency trading needs a strategy and a good way to be successful at it. The things that are the main points and have an important influence must be well prepared and analyzed. Such as charts, prices, market trends, and all things related to technical analysis in the cryptocurrency market. Trading management is also needed to bring profits and minimize losses.
Note : All the images in this post are from my screenshots on https://www.tradingview.com
Thank you for reading my blog, hope it will be useful for all of you.
CC :
@yohan20n
@steemcurator02
Hello @elnieno,
Thank you for participating in the 7th Week Crypto Course in its second season and for your efforts to complete the suggested tasks, you deserve a 9.5/10 rating, according to the following scale:
My review :
An excellent content through which you were able to address the topic in all its aspects clearly and precisely. You could have relied on some technical analysis indicators to help you extract many signals in this style of trading.
Thanks again for your effort, and we look forward to reading your next work.
Sincerely,@kouba01
Thank you so much professorrr!!!!