Steemit Crypto Academy // Season 3 week 3 // Homework Post for [cryptokraze]
QUESTION 1
What do you understand about the concept of dynamic support and resistance? Give chart examples from crypto assets. (clear charts needed)
Dynamic Support and Resistance
Support and Resistance levels has always been a very key level which so many traders watch and find, and when properly gotten we can say we get a good chance finding entry positions.
These dynamic support and resistance levels are levels which prices makes a rebound on, or keep retesting on the level.
We often use horizontal lines, trendlines and indicators such as the Bollinger bands to act as support and resistance level.
In this lecture, as explained by professor @cryptokraze, we will be using the exponential moving average to act as our dynamic support and resistance levels.
Using the Exponential moving average on charts we will have two scenarios, where it acts as a support and where it acts as a resistance.
Scenario A(EMA acting as Resistance)
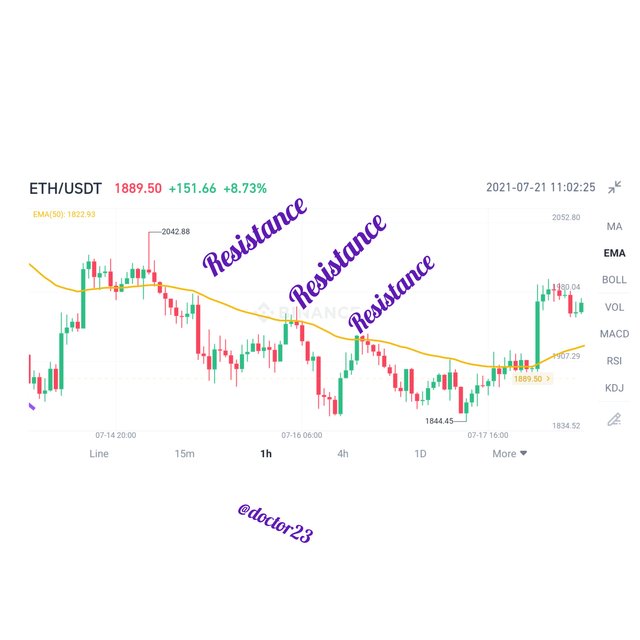
Using the crypto pair above, we notice that each time the prices touches the 50 Exponential Moving Average, the prices retest and goes downward.
Scenario B (Acting as Support)
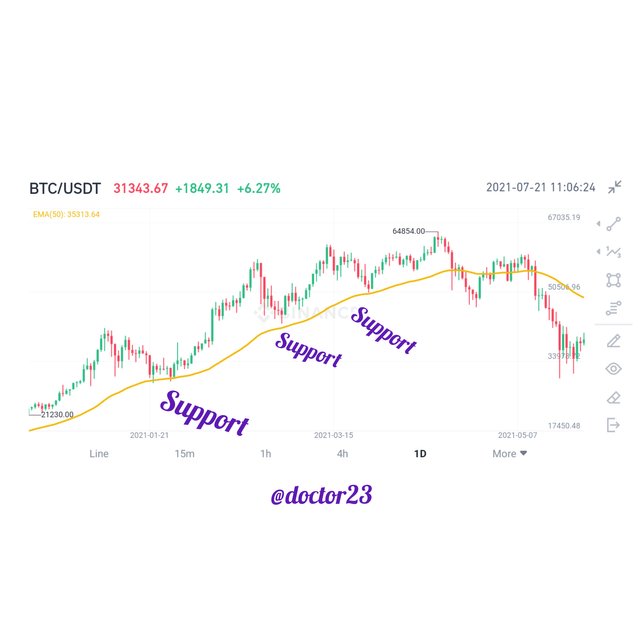
For the Exponential Moving Average to act as Dynamic support level, it means each time prices touches the EMA, the prices bounces off. The more the prices bounces off the EMA the stronger it is. And example is with the crypto chart above.
Scenario C (Combination of 50 and 100 EMA)
We can also combine the 50 level EMA and 100 EMA to act as our dynamic support and resistance level, this actually increases the chances of trade entry and exit, as we can use the 100 level in finding our stop loss positions
QUESTION 2
Make a combination of two different EMA’s other than 50 and 100 and show them on crypto charts as support and resistance. (clear charts needed)
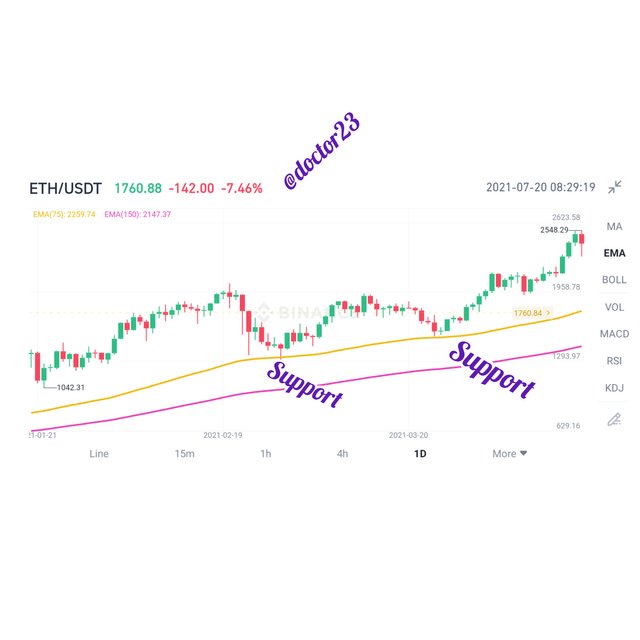
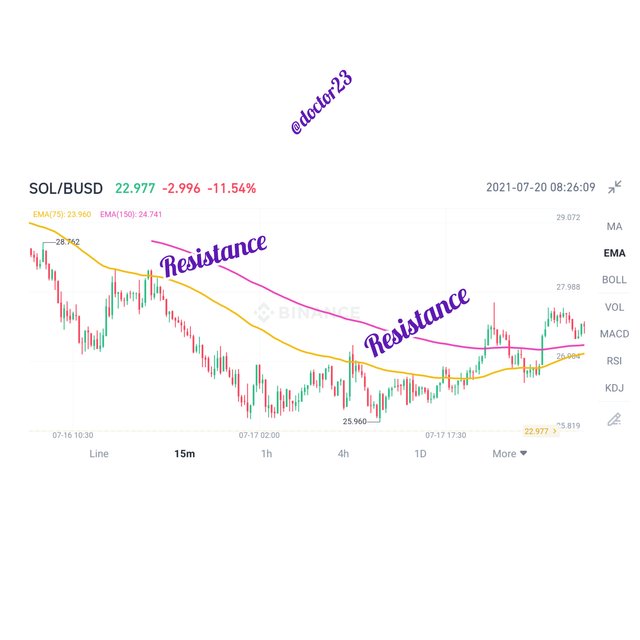
Combination of the 75 and 150 level EMA
I particularly choose the 75 and 150 Exponential Moving Average, after carrying out some research on it. I took some trades and it worked perfectly. The combination of the two levels, with the 75 acting as the dynamic support or resistance level, and using the 150 to set up trade exit criteria.
Why i choose the 75 and 100 level.
The 75 level will act as a dynamic support and resistance level, it will normally take more time before prices rebound on the level, but once it does it will be more strongly.
The Take Profit level is set in reference to the stop loss level. With this level, the stop loss level will be a bit further up than using the 100 level, setting R:R to 1:1 means we will have higher profit if take profit hits.
Though not all strategy is particularly perfect, but i think the levels are good
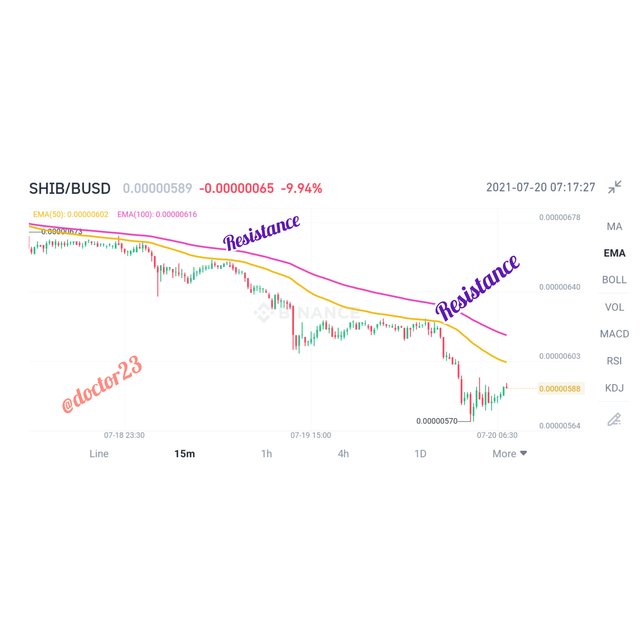
Acting as Support
Acting as Resistance
QUESTION 3
Explain trade entry and exit criteria for both buy and sell positions using dynamic support and resistance on any crypto asset using any time frame of your choice
Trade Entry and Exit for Buy Order
Trade Entry
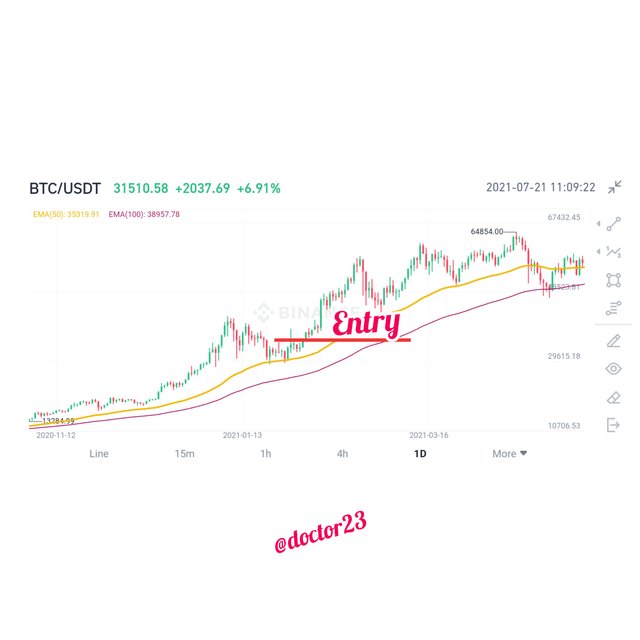
As explained by Professor @cryptokraze, I will be using the 50 and 100 level Exponential Moving Average to act as my dynamic support and resistance
The following procedure will be followed to enter a trade.
- once the EMA indicator has been added, for a buy entry, the prices should be above the two Exponential moving averages.
- we then wait for the prices to touch the 50 level or cross it.
- we then place a buy order when a rebound has been on the 50 level, and the prices have move up just a few pips.
Trade Exit
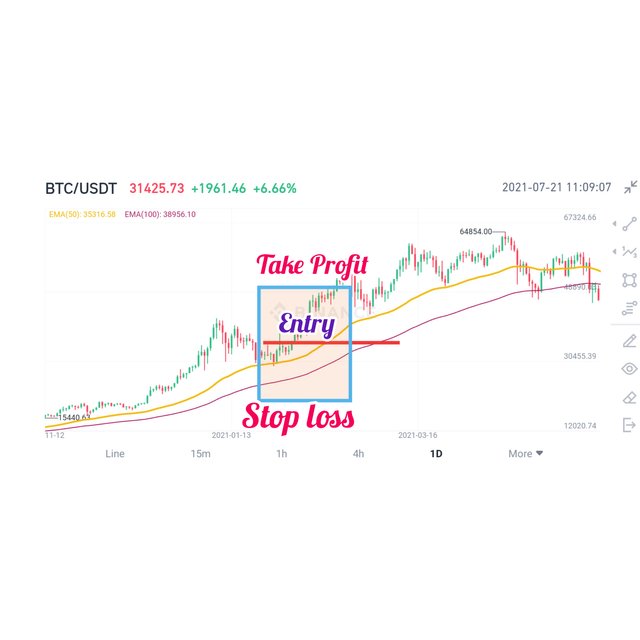
Exiting the trade means we will be setting our stop loss and take profit levels.
- our stop loss level will be set using the 100 level of the exponential moving average.
- the stop loss will be placed just a few pips below the 100 level.
- if prices does not go as we predicted, stop loss point will be touched and trade exited to secure account from further loss.
- take profit level will be set using the stop loss level. Meaning we will be using a risk to reward ratio of 1:1
- if prices hit my take profit level as planned, profit will be booked and trade exited.
Trade Entry and Exit for Sell Order
Trade Entry
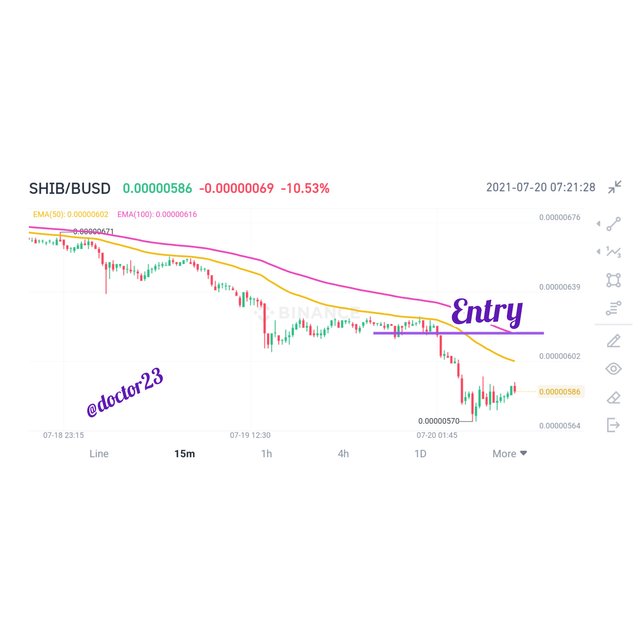
I will be using the 50 and 100 level Exponential Moving Average to act as my dynamic support and resistance
The following procedure will be followed to enter a trade for a sell position.
- once the EMA indicator has been added, for a sell entry, the prices should be below the two Exponential moving averages.
- we then wait for the prices to touch the 50 level or cross it.
- we then place a sell order when a rebound has been on the 50 level, and the prices have moved down just a few pips.
Trade Exit
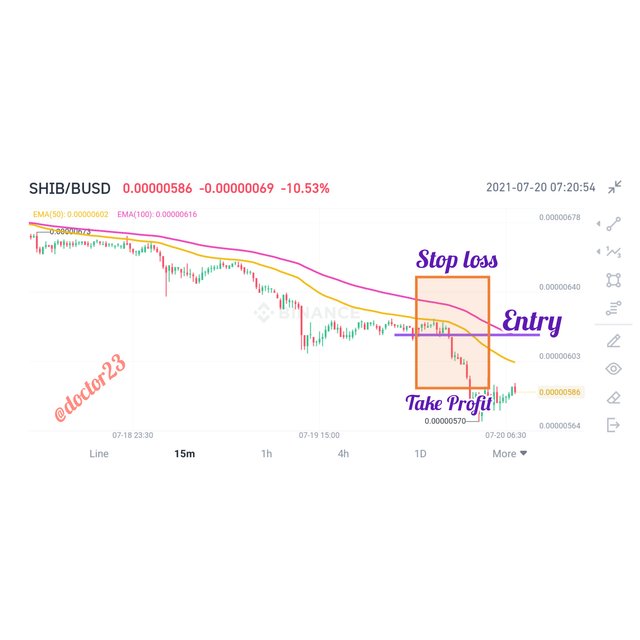
Exiting the trade means we will be setting our stop loss and take profit levels.
- our stop loss level will be set using the 100 level of the exponential moving average.
- the stop loss will be placed just a few pips above the 100 level.
- if prices does not go as we predicted, stop loss point will be touched and trade exited.
- take profit level will be set using the stop loss level. Using a risk to reward ratio of 1:1
- if prices hit my take profit level as planned, profit will be booked and trade exited.
QUESTION 4
Place 2 demo trades on crypto assets using dynamic support and resistance strategy. You can use lower timeframe for these demo trades.
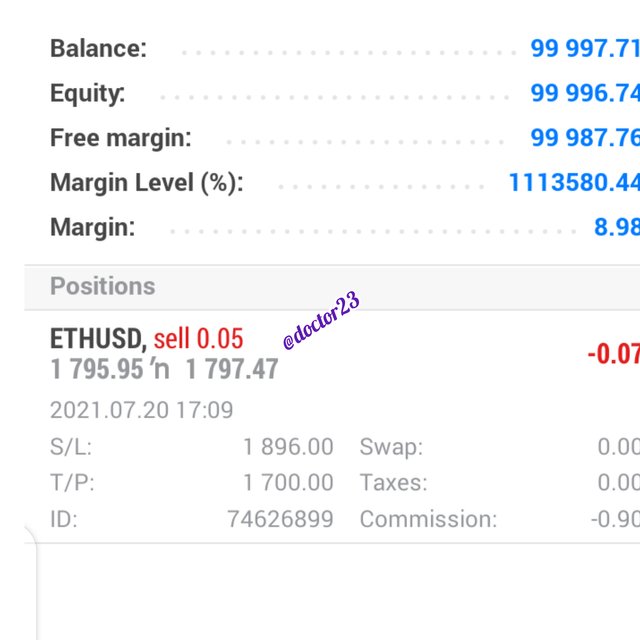
Demo Trade on the eth/usd Pair
I begin by adding the 50 and 100 level Exponential Moving Averages.
As show in the chart we have have previous levels which the exponential moving average acted as a resistance level.
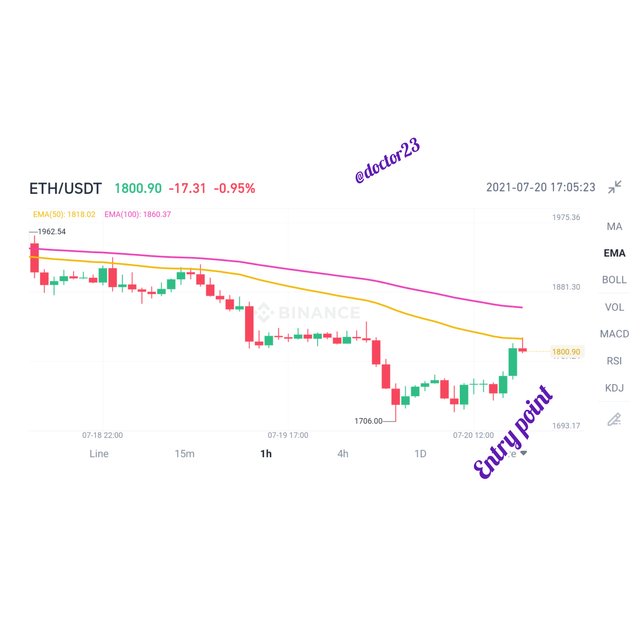
The prices are currently below the EMA, so I waited for a rebound on the resistance level and entered a sell order a few pips below the 50 level EMA
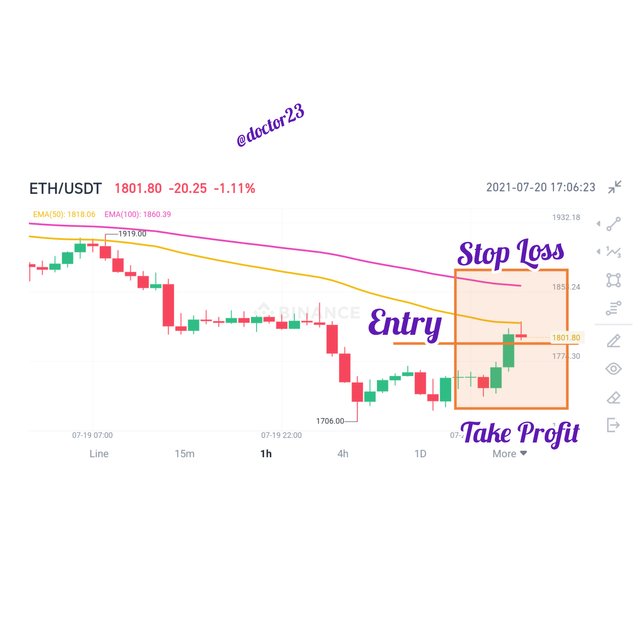
Exiting the trade means I will be setting my stop loss and take profit levels.
- my stop loss is placed a few pips above the 100 level so if prices does not go as I planned trades will be exited and secure my account from further losses.
- take profit level is set using the stop loss level. This is done using a risk to reward ratio of 1:1. if take profit level hits as I planned, profit will be booked and trade exited.
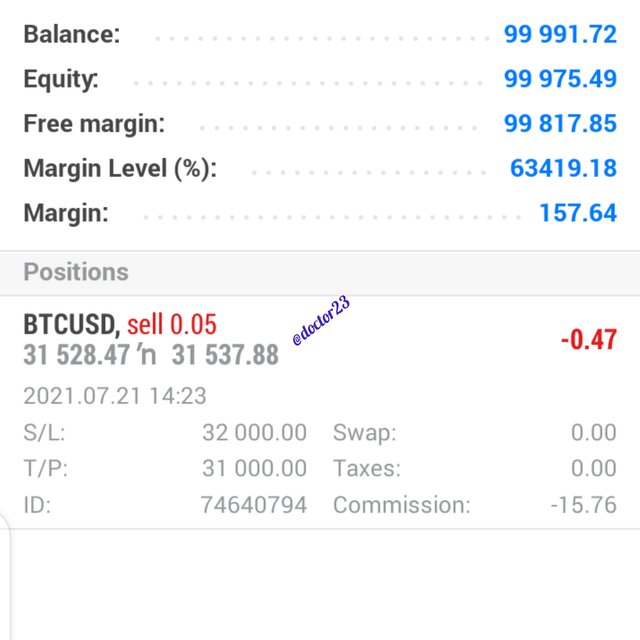
Demo Trade on the btc/usd pair
I begin by adding the 50 and 100 level Exponential Moving Averages.
As show in the chart we have have previous levels which the exponential moving average acted as a resistance level.
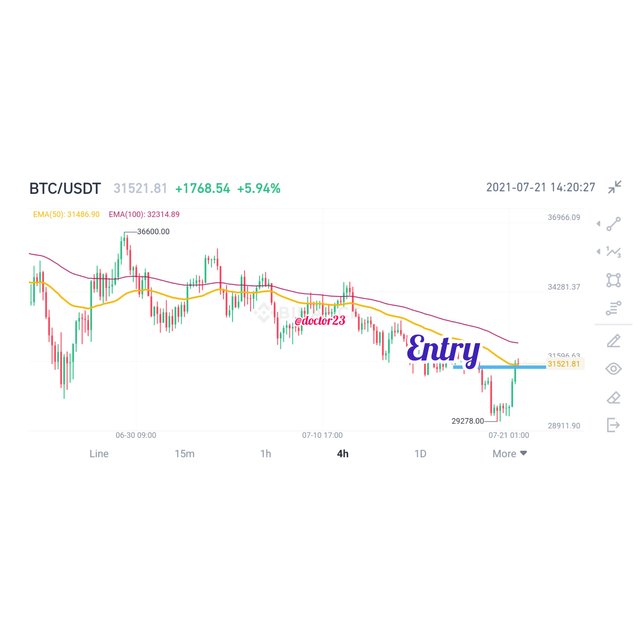
The prices are currently below the EMA, so I waited for a rebound on the resistance level and entered a sell order a few pips below the 50 level EMA
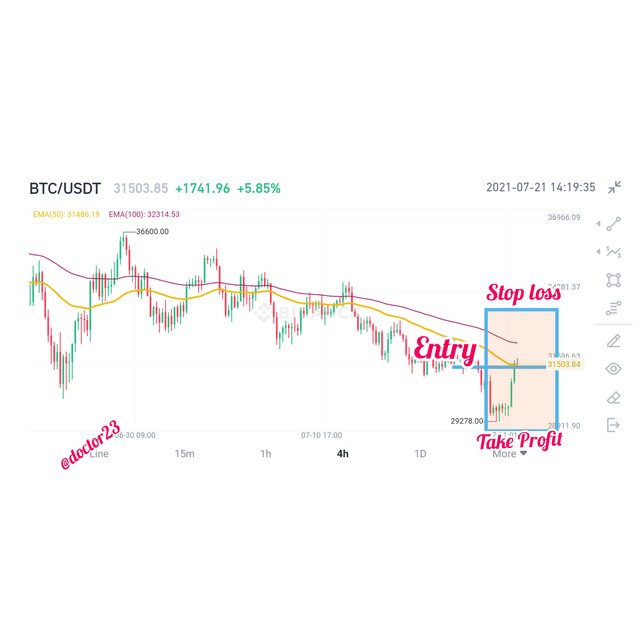
Exiting the trade means I will be setting my stop loss and take profit levels.
- my stop loss is placed a few pips above the 100 level so if prices does not go as I planned trades will be exited and secure my account from further losses.
- take profit level is set using the stop loss level.
This is done using a risk to reward ratio of 1:1. if take profit level hits as I planned, profit will be booked and trade exited.
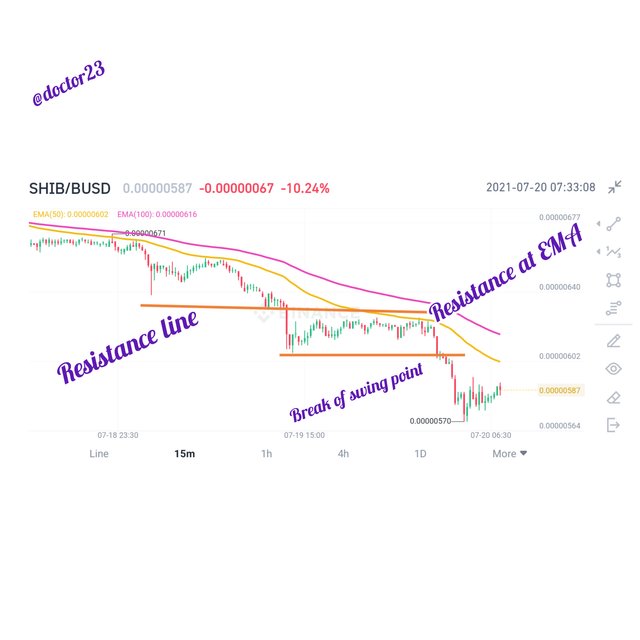
Others
We can also trade the dynamic support and resistance alongside other indicators or strategy such as the Break Reverse Break Strategy.
Conclusion
We can find Dynamic support and resistance levels using the Exponential Moving Average. The 50 and 100 level have been proven to more successful as per my analysis and demo trading. With the 50 level used to find key entry levels after a rebound of prices on it while the 100 level can be used to identify stop loss positions which will intend determined the take profit level.
Dear @doctor23
Thank you for participating in Steemit Crypto Academy Season 03 and making efforts to complete the homework task. You got 7.5/10 Grade Points according to the following Scale;
Key Notes:
*.You have shown good understanding of the strategy by making precise charts for different elements of the strategy. In marking the Exit areas, you have kept the Stop loss a bit more high or below the 2nd EMA and that can take more time to reach 1:1 targets
We appreciate your efforts in Crypto academy and look forward for your next homework tasks.
Regards
@cryptokraze