{Steemit Crypto Academy - Season 2, Week 6} Elliott Wave Theory - Teoría de las Ondas de Elliott

First I wish to appreciate Professor @fendit for this week's incredible lecture to be precise and I am happy being a part of it.
What's the application of this theory?
Really the application of this theory is an exposition into the psychology and brain behind the market operation.
Hence this theory is actually a technical indicator which actually gives a clear view into making certain trade analysis and actually ascertaining the future prices of stocks by accurately applying the theory.
There is no certainty that this technical theory provides a perfect future price movement but in the contrary it can actually assist in accertaining a futuristic price movement or action.
Now this theory has different forms and trends of price views at different stochastic or fractal intervals. For instance the impulse wave which is a combination of both up and downward trend has 5 waves with different time intervals and there are some notables in them which are:
the regression of the second wave cannot be over 100% compared to the 1st wave.
The third wave is lengthier than the 1st and 5th wave and finally the 4th wave cannot be lengthier than the 3rd wave as indicated by the trend.
Now in practical, taking the impulse wave for instance as pretty explained by Professor @fendit, I can say that it is profitable if at spotting the market trend taking an upward direction, one can go for a long trend and wait until the trend gets to it's 5th wave which is it's peak level. Then he can apply for a reversal trend because of the fractal nature of stocks.
Nevertheless taking a comprehensive drive into the Elliots's theory , it is actually view that invariably identifies price as a psychological trend through which peoples market behaviour are partitioned.
What are impulse and corrective waves? How can you easily spot the different waves?
The impulse and corrective waves are actually the bull and the bear market trends that are spotted in a training pattern. Now they came be explained as follows:
THE IMPULSE WAVE:
This wave normally goes in the same direction with the market trend in general is normally bearish and bullish in nature.
The impulse wave has a direct relationship with the market trend, hence if the market trend is in positive direction or or upwards, the impulse wave on the other will as well go in the same direction.
This establishes the fact that the impulse wave has a direct trend relationship with the real market trend further the impulse wave has a 5 wave possibilities.
ANALYSIS OF THE IMPULSE WAVES
WAVE 1: In this level of the trend, which is an ushering in of the Bullish trend, prices here are relatively low which creates an incentive for investors to purchase some reasonable quantity of an asset and then they sell at the slightest price changes or increase as to make some profit.
WAVE 2: This 2nd wave is a reversal of the first wave because of the fractal or zigzag nature of stock prices. Nevertheless at this point the prices are low which creates room for investors to buy a larger quantity of assets.
WAVE 3: At this point, due to the large quantities of purchases made in the 2nd wave It will automatically usher a bull trend which will be the longest in the trend and the wave on the other hand maintaining a continuous price increase at a point will now set in another reversal taking us to the 4th wave.
WAVE 4: In this senario which is a similar trend with the 2nd wave, at this wave the price goes down probably because of the increased sales in the previous wave and further at this stage there will be an increased purchases which will further bring about an increase in price in the 5th wave.
WAVE 5: This is actually the last trend in this impulse fractal trend. The price in this wave is actually the highest, and normally there will be an over sell by traders and that will usher in the corrective wave.
On the other hand, let's look into the corrective wave.
The corrective wave is the opposite of the impulse wave which is spotted after the 5th wave in the impulse trend/wave.
It is spotted with A, B AND C wave pattern and A and C takes the same direction while B takes an opposite/different trend pattern.
What are your thought on this theory? Why?
Since this theory is actually a proven indication of future rise and fall in the prices of stocks, which indicates the preceeduence of a down trend after a bull rush which really apply in real life.
Nevertheless, it is actually a good to do theory because it is based on a valid and attainable argument and has been proven over decades as it has kept its confidentiality as a theory.
For me, I have not seen any cons in it because it is actually a valid and proven theory that has stood out over the test of time in it's all time technical manipulation as The accountant Elliot actually made a thorough research and indepth investigation before bringing out this theory, even as well explained by professor @fendit.
B) Choose a coinchart in which you were able to spot all impulse and correct waves and explain in detail what you see. Screenshots are required and make sure you name which cryptocurrency you're analyzing.
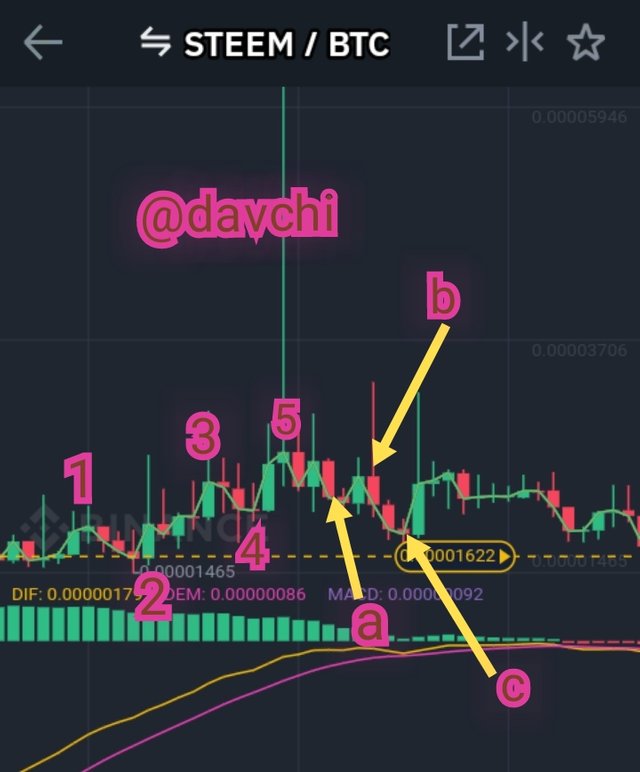
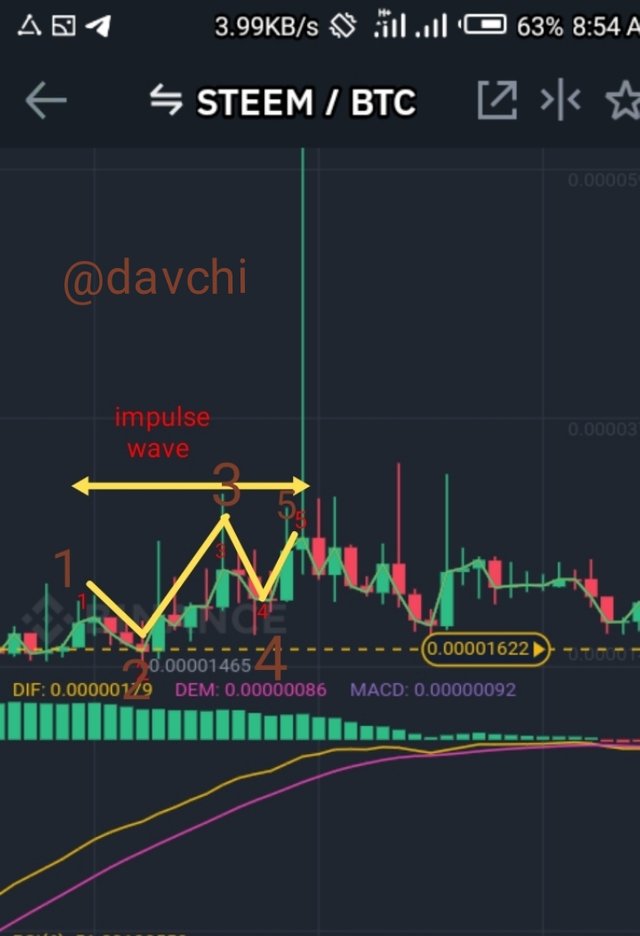
Viewing from my spotted screenshot of STEEM to BTC from Binance I can deduce and analyze thus:
From the first wave, the point i marked 1, which is actually the inception of the impulse wave where investor are waiting for the next market trend so that they could either buy Bitcon or sell their steem.
The inception of the second wave is an indication that the price of steem to Bitcoin has reduced which shows that there is now a decline in the price of steem, hence investors can get much more steem at a lesser rate exchanging it with the Bitcoin.
Now because investors now purchases a large quantity of steem because of it's low price, given the value of Bitcoin, the price of steem now automatically adjust to a bull rush at the 3rd wave.
The third wave is actually the lenghtiest trend in the impulse wave, at this point the price adjust because of the over bought of steem caused by it's relative low price at the 2nd wave. Here as price increases people now sell their assets, at the expense of increased sales, the price now regresses to the 4th wave.
Though the fourth wave is of the same trend with the 2nd wave but it is not equivalent in it's price but invariably, the price of steem at this point is still down. At this point, investors also buys more because of price decrease and the market also adjust to a bull trend taking is to tye final wave being wave 5.
This wave (the point in marked 5) is actually the peak of all the waves on the impulse side ofthe market and at this point investors makes a very reasonable profit by selling their assets and finally because of the high increase in the price of steem, the market now automatically adjust to usher in the corrective wave which is now in opposite direction to the impulse wave.
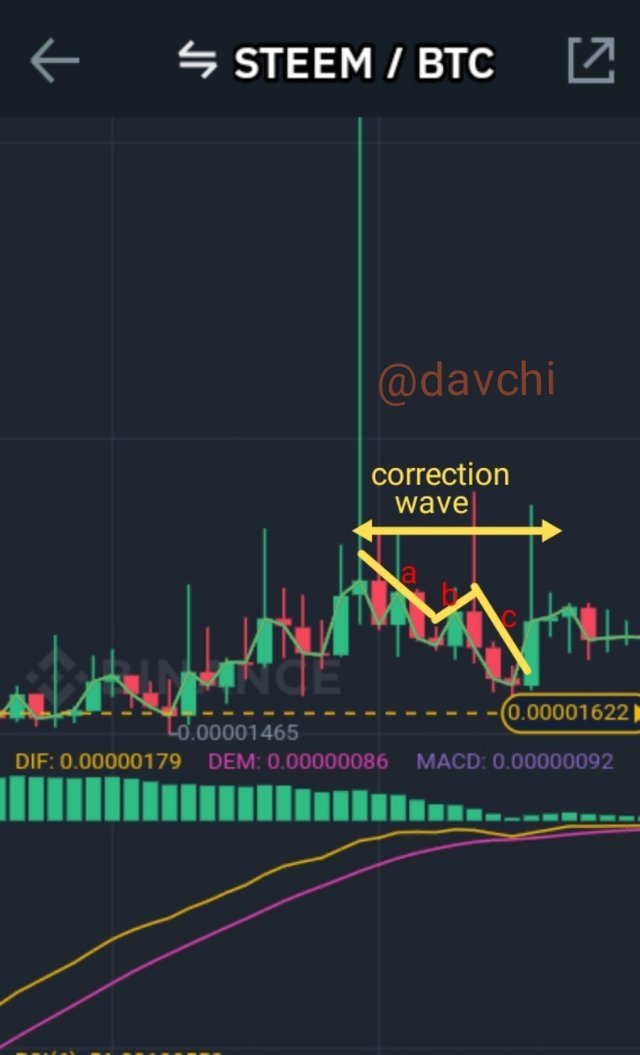
On the other hand after the impulse which stopped at wave 5, the market regresses into the bear market where it now gall at the point I marked a because if the decrease in the price of steem.
Nevertheless, the price of steem falls to the point "a" and then rises again to the point "b" and finally regresses back to the point "c" which is almost the same trend pattern with the impulse method if not for the variation in the nature of the 3rd wave
Indeed the Elliot theory has been proven to be a true techniques that can expedite a rational modus operandi In trades if vi idly and prudently adhered to.
Thanks for patiently going through my post I'm grateful especially to professor @fendit for such an incredible lecture.
Thank you for being part of my lecture and completing the task!
My comments:
Nicely done!!
Very good development and application of the concepts we discussed and really interesting analysis on the STEEM variation! :)
As a suggestion, make sure you focus a bit more on markdowns next time as that can get you a higher score :)
Overall score:
7/10
Alright professor, I'm grateful that you went through my post, it's really my pleasure thanks immensely.
Twitter details
https://twitter.com/david_chinatu/status/1396092968579256321?s=19
https://www.facebook.com/100030431131736/posts/522988132058887/?app=fbl
That's cool