Crypto Academy Week 13 - Homework Post for [@yohan2on]
Hello professor @yohan2on and SteemitCryptoAcademy, today I'm handing in the Scalping task. I'm grateful to have been able to participate in this activity as always! I hope you enjoy my work, it really helped me learn more about Trading strategies. Best regards!

Demonstration of scalping using the scalp trading strategy with finger trap on ETHUSD and BTHUSD.
Scalping is basically a technique that involves opening and closing trades in a very short period of time in order to make quick profits. This trading method is based on opening trades and closing them with small profits, in smaller time frames.
This strategy uses the crossing of the 8 EMA and the 34 EMA to scalp in the direction of the trend. For this it is necessary to be constantly checking the trend of the chart with respect to short time frames. At the beginning of the trend, it is pertinent to wait for the price to pull back towards the 34 EMA and then we can observe a breakout of the range or a swing high or low and a close of the candlestick.

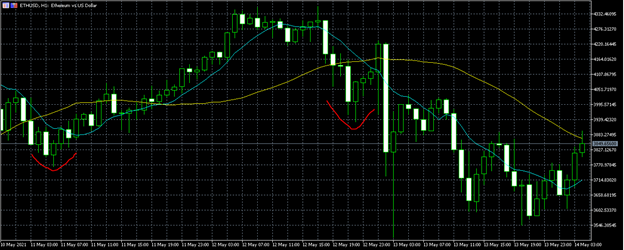
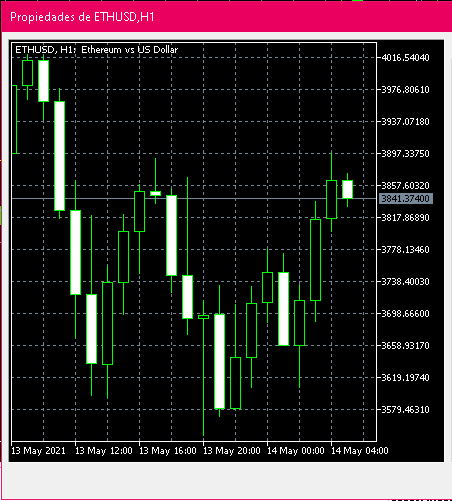
ETHUSD Finger-trap scalp trade
We should check to make sure that the STO is generally around 50 and has room to run in the direction of the trade. We will have an automatic Stop Loss of 10 pips, but after entry, we should move it just above or below the swing high or low, or also, above or below the 34 EMA. After reaching the 3 and 5 pip targets, we will move the Stop Loss on the remaining trade just above breakeven and let it reach the 8 pip target, although we could also let it run until a candle closes on the other side of the 8 EMA.
The best trades are when price pulls back or approaches the 34 EMA and then closes back below the 8 EMA. After the initial breakout, we should look for pullbacks and a close inside the 8 EMA, and then subsequent entries as soon as the 5M candle closes back in the direction of the trend on the side of the 8 EMA. We know that trend lines function as a tool that allows us to try to find the pace at which the market is moving for when prices start to break from a trend line. When a trend line starts to break what we are actually seeing is a change in the pace and balance of power.
Criteria for the buy signal
- The trend must be upward: 8EMA> 34EMA> 100 or 8 EMA> 34EMA; stochastic must be positively trending.
- Sell when the price returns and bounces off the 8 EMA.
- Buy on re-entry when the stochastic indicator turns below the 20 level, crosses upwards and the above conditions are in agreement.
Criteria for the sell signal
- Trend is upward: 8EMA <34EMA <100 or 8 EMA <34EMA; stochastic crosses to the downside.
- We should buy when the price returns and bounces off the 8 EMA.
- We will go for re-entry when the stochastic indicator turns above the 80 level, crosses to the downside, as long as the above conditions are met.
- First Stop Loss 15-20 pips. When it happens that we are making profit we should move our Stop Loss to the break-even point.
- Our profit target should be in the range of 8-12 pips or at the pivot levels.
- For money management we should consider the following example for relevant cases: a 5-minute chart that never exceeds a risk of 1% per trade which, with 3 losses in a row, could easily lose 3% in a day.
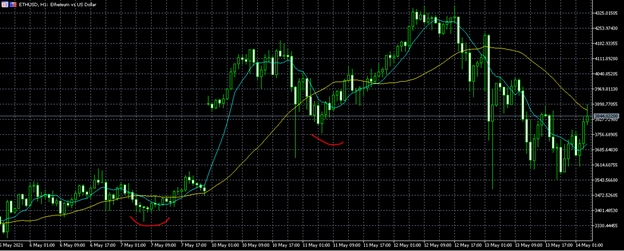
BTCUSD Finger Trap Scalp Trading
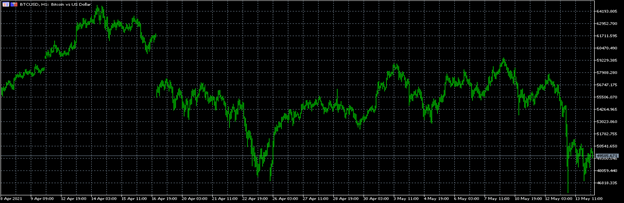
In this case we have a bearish trend line connecting the peaks with the price, so this would be our longer term trend line, as this is indicating the prevalence of the long term positive trend. This line indicates to us that it may break out sooner in the longer term and that puts us on alert for a potential change in the state of the market. Now, we can also see a break above our low and this also indicates possible tentative longs. So this is what a change in trend shows us.
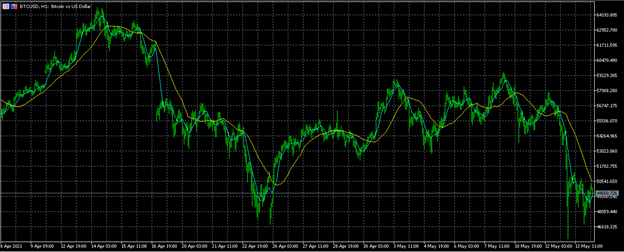
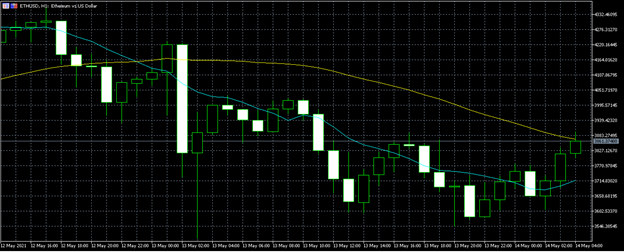
This chart shows us a downtrend, uptrend and flat average, this is a sign of a market in trend transition or a trading range. All indications are that from this point on the price will break above or below the moving average a few times so this is probably not the way you would want to enter a trade. However, consistently traders are going to use a close above or below the moving average for trend direction.
Combining these two things, trend lines and the 34 EMA, now since we see that trend lines show a rhythm in the market, and when this rhythm finally breaks, combine it with the average for trend direction and be able to use it as an entry trigger, that's what we mean by finger-trap in Scalping.
Thanks to professor @yohan2on for teaching us this quality of content, this tasks put to test, and everyday I'm working to get better and better. Thank you for your time and dedication!
...
Hi @cryptomaniatic
Thanks for participating in the Steemit Crypto Academy
Feedback
The explanation of the finger trap strategy was not clear. The screenshots presented were also not clear. You just talked about setting the stop loss but I did not see that reflected in the charts screenshots you provided. Kindly put more effort into your work.
Homework task
3