Crypto Academy | Season 2 - Week 2 | Homework Post for @stream4u | All About Price Forecasting
Dear Steemians,
It feels like yesterday when Steemit Crypto Academy season 2 started with 1st set of lectures and here we are, with 2nd week and new lectures by Crypto Professors. This is simply amazing that how quickly time passes while learning good things.
When I read the Lecture Title All about Price Forecasting by @stream4u, I knew that it is going to be an excellent one and it was simply amazing how brilliantly our Professor has explained the forecasting concept with examples.
In this week, Steemit Crypto Academy Professor @stream4u has explained in-depth about Price Forecasting with examples and I was able to understand the following thing from this lecture;
- Concept of Price Forecasting
- Method of Price Forecasting Based on Technical Analysis
- Need of Price Forecasting

HomeWork Task
At the end of the lecture, students were assigned a homework task by Professor @stream4u.

Make a Homework Task Post on the below Topics which you can also discuss according to your views on it, and try to explore it as much as possible but in simple terms.
1 - What Is Price Forecasting?
2 - Discuss on why Price Forecasting is needed?
3 - What Methods are best you feel for Price Prediction/Forecasting.
4- Take any Crypto Asset Chart graph and explain how to do Price Forecasting? OR Take any Crypto Assets Chart graph & as per its current price tell us what will be its future price for next 1 week or 1 month? You can predict for any direction up or down but explain it properly on what basis you have predicted the price.
I am submitting my task through this post by answering the four questions asked by our Professor.

1 - What Is Price Forecasting?
If we want to define price forecasting, it means to predict the price of an asset in the coming time that can be hours, days, weeks or months. In other words, price forecasting is measuring the probabilities of an asset's price going up or down in the future so we can take decisions about investing or trading that particular asset.
There are three types of analysis methods used by traders to do price forecasting which are Technical, Fundamental and Sentimental. Let me brief you a bit about these types of analysis with examples.
Technical Analysis
In this type of analysis, traders use different tools to predict the upcoming price of a coin or asset, like chart and candle patterns, support & resistance, technical indicators, market trend and liquidity zones.
Example:
Litcoin in the below chart, has broken the important resistance zone with the impulsive move and then price retested that level. This is where we should be buying it and expect the price to make 2nd impulsive move. The same happened and price made the impulsive move, giving a profit trade yielding 1:2 Rewards at least.
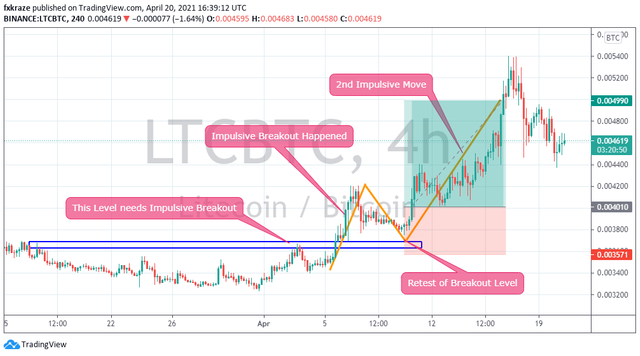
Chart Image Created using my Tradingview Pro+ Account
Fundamental Analysis
In this type of analysis, traders are looking at the project value and utility, company profile, management team, products and future plans, company growth and profits. If they find a project is good and worth investing in, they invest in that project or asset. They can invest for long term or trade for short term gains as well.
Example:
Binance is a project that has done amazingly well in the last 3 years and they are continuously adding more features to their platform. So we know that it is a good company so it is good to invest or trade in Binance Coin.
- At the start of year 2021, bitcoin was already moving good and a bull run in the crypto market was knocking on the doors. As a trader, we know by the fundamental analysis that Binance has done amazing in the last few years, so BNB coin will go higher in this upcoming bull season, so a good trader would buy BNB coin.
- BNB coin price was around $40 at the start of 2021 and anyone who bought at that price would have been in 12X profit with current price hovering around $550 mark.
- You can see the smooth growth curve for Binance coin and it is a sign of a good project.
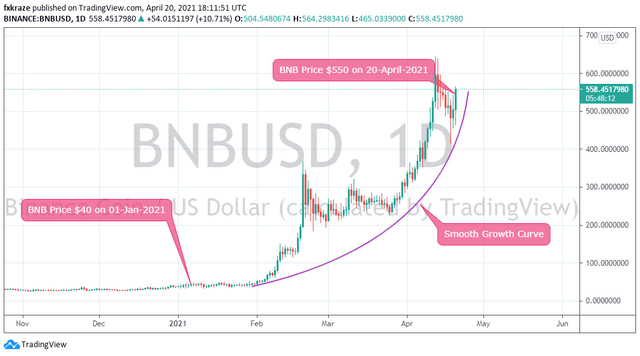
Chart Image Created using my Tradingview Pro+ Account
Sentimental Analysis
In this type of analysis, the market is driven by the news, media forums, Twitter trends and few influential personalities that lead to create hype of that project or assets. This brings volume, liquidity and volatility in the market. This can be a good and quick way to make some big bucks but it can burn you at the same time because the high volatility can send you in big drawdown quickly.
Example:
DogeCoin was considered a shit coin before Elon Must tweeted about it in the start of the year and created the first hype. Price jumped big time. Everyone started taking interest in buying and market sentiments started developing. This resulted in the accumulation of liquidity and the Big liquidity was injected in the last week of April making the price increased 700% in 1 week. So everyone who bought during the sentiment development phase got huge profits. The majority of the people in the crypto market are still in this sentiment of Buying Doge and it can go even further higher.
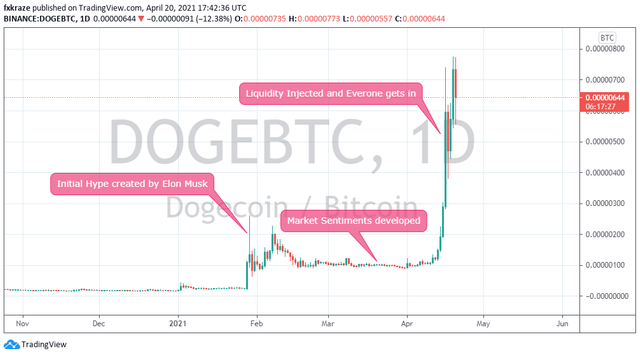
Chart Image Created using my Tradingview Pro+ Account
2 - Discuss on why Price Forecasting is needed?
Most of the people is the Crypto market have that misconception of BUY and HODL. This is where I feel we need to learn how to forecast and make analysis and then trade or invest in any asset. In my point of view, we need price forecasting due to following reasons
Right Entry and Exit
One of the main reasons why I do price forecasting or analysis is to know my areas of entry and exit areas. In that way, I will know that when I have to buy any asset and when it is time to sell to avoid missing my profits.
Profit Taking
If anyone doesn't know about the technical analysis, he would not have the idea when to take profits. This is where we need forecasting because we know the levels where we should close a certain trade and take the profits. Remember, it is always to good to do some profit-taking.
Cutting Losses
One of the biggest reasons why traders lose in trading is wrong hope. People keep hoping that the price will return but they don't know the technical aspects. If a trader knows how to make technical analysis, he will know that after a certain price level is breached, it is time to cut the trade and accept the loss. So we need to learn price forecasting so that we can cut our losses in time.
Multiple Trade Opportunities
If anyone knows how to forecast and make technical analysis, he will have more opportunities to trade. He can take multiple trades in shorter time frame during a consolidation phase by buying at the bottom on the range and selling at top of the range. If the market is in a trend, he can take profits after each impulsive move top and buy at bottom of each pullback or dip. All these smart moves will make you independent and not worried about missing an opportunity because you will know that there will be more opportunities to make profits.
Reduce Emotions
When we are in a trade, our emotions tend to override our decision making. If a person don't know about price forecasting, he will be under fear when price is going against him and he will be under greed when price going in his favour. So one of the reasons why we should learn forecasting is to reduce emotions affecting our trade decisions. When we have taken trades according to analysis and forecasting, we feel more confident and know when to enter and exit from a trade.
3 - What Methods are best you feel for Price Prediction/Forecasting ?
No doubt, every type of forecasting has its own importance and we cannot neglect any of them but when it comes to my liking, I am more comfortable using Technical Analysis. There are following reasons why I feel Technical Analysis is best for Price Prediction and Forecasting.
More Trade Opportunities
There will be many trade opportunities if we are trading according to technical analysis because we can trade multiple assets at multiple timeframes. I tend to scalp few quick trades when price is making fast moves with high volatility. If price of a certain asset or coin is ranging in consolidation, it is way to easy to buy at the bottom and sell at the top. I can make profit from scalp, intraday and swing trades even on the same coin.
Confidence Booster
When you start trading according to technical analysis, we get that confidence when our trades start going according to plan. There is a great feature in the market that it repeats patterns. So if we are trading a certain pattern, we will know the probability of next market move when we see a certain pattern started to form. I have done it personally so many time and it really has boosted my confidence.
Easy to Work
There is a misconception among most of the traders that it is very hard to learn technical analysis but let me assure you one thing that it is way too easy. All you need is commitment and once you start practicing one particular method or pattern, you will find it so easy to trade. I have so much practice of technical analysis that I don't even mark those lines and indicators on my charts and just 1 look is good enough for me to see the current situation.
Potential of Making More Profits
This I feel is the biggest advantage of technical analysis that you can make big profits especially on the exchanges that are offering Margin Trading. A technical analysis expert knows the exact levels of entry and exit from a trade so he can make those quick trades on Margin Trading and make himself big profits. This advantage is not with other types of traders who just rely on fundamental analysis.
No Pressure
As a technical analysis trader, there is No pressure on me because I have set my entry and exit areas. I am just focusing on my strategy to get a better win ratio and we get that higher winning if we keep working on a method. On the other hand, a trader who has just randomly bought any coin, remains under constant pressure and fear of what will happen next.
4- Take any Crypto Asset Chart graph and explain how to do Price Forecasting? OR Take any Crypto Assets Chart graph & as per its current price tell us what will be its future price for next 1 week or 1 month? You can predict for any direction up or down but explain it properly on what basis you have predicted the price.
The last question by our Crypto Professor was to take a crypto asset chart and explain the process of forecasting. So I have selected Litecoin for my analysis and forecasting. My favourite method of technical analysis is to "Trade the reversal from liquidity zones, confirmed by market structure break". So Let me walk through the process I am using to forecast and take my trades.
My Analysis on Recent Reversal
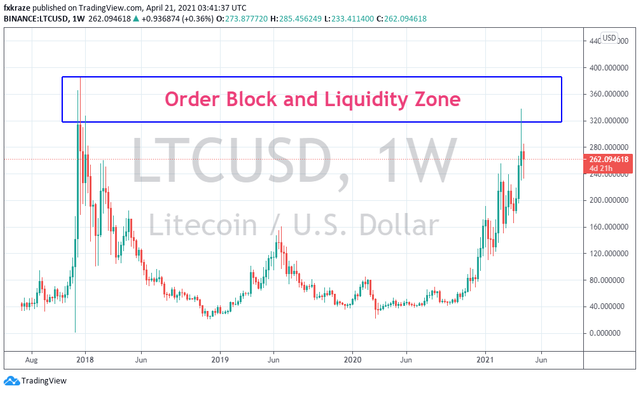
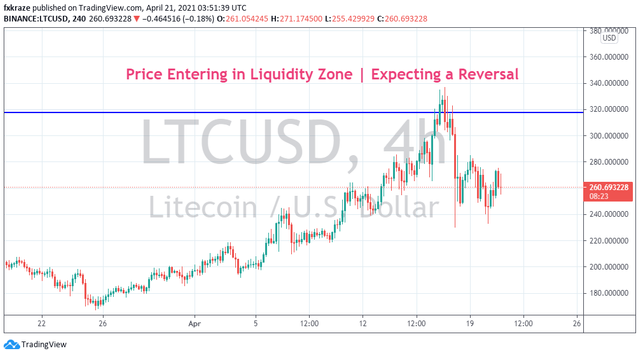
- This below chart is on the Weekly timeframe and I am using it to see the bigger picture. As you can see I have marked the Order blocks and Liquidity zone $320 to $380 area. Liquidity zones are the areas where most of the big orders are placed in terms of Take Profit and Stop Losses. So the market will go for next liquidity zone to fill those orders. I expect a reversal from that liquidity zone.
- Next step is to shift onto H4 time frame to get a better view of market structure. As litecoin entered into that liquidity zone, I was getting ready for a reversal trade setup. This is not just placing a sell as the market enter in the liquidity zone but I wait for confirmations before entering into a trade. The reversal can start anywhere from that $320 to $380 area.
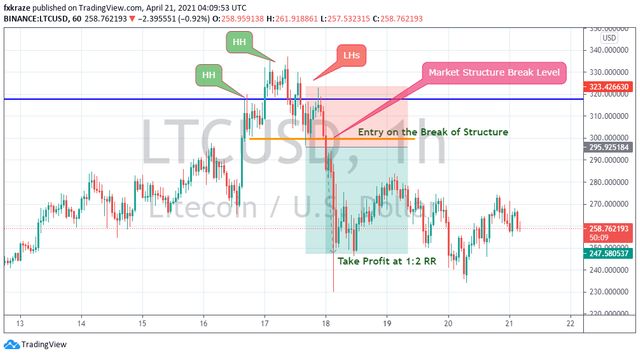
- I shift to H1 timeframe for getting my entry confirmation of reversal sell trade. If you see price has made higher highs (HH) and then it made Lower Highs (LH). This is a sign of market structure reveal and it will be broken ultimately. I have marked the market structure breakout level, this is where I will be entering into a sell on the break on that level. Normally I set for a setup giving me at least 1:1RR and in this case price made a sharp reversal and went onto hit 1:2RR profits.
Forecasting Next Move for Intraday Trade
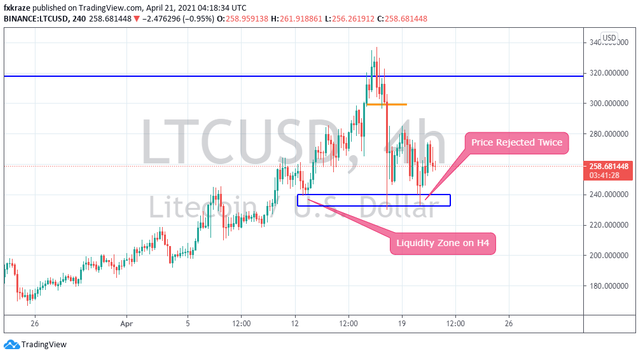
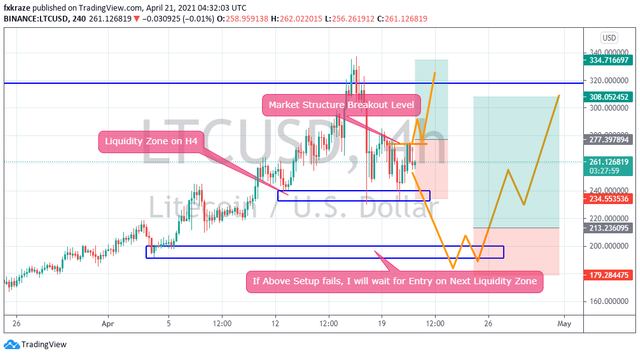
- If you see the below chart, I have marked the next important liquidity zone on H4 time frame around $230 area. You can see the price has been rejected from that zone twice now. This is where it got me interested and I am marking my charts for next probable move to take my next intraday trade.
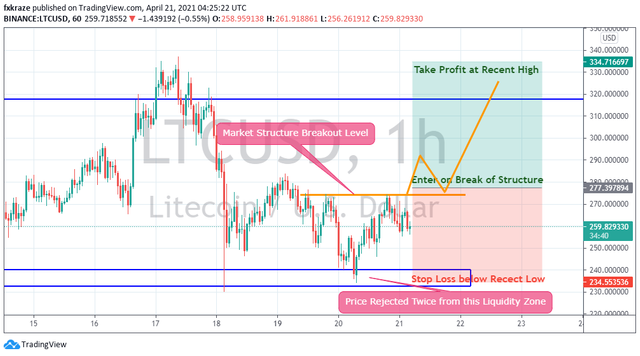
- I shifted onto H1 time frame to get my entry confirmations for my intraday trade. Currently, price has rejected from that liquidity zone twice and also made Higher lows, which is sign of market structure reversal to upside. Now I have marked the market structure breakout level. I will be entering Buy Trade on break of that level and my take profit area would be near recent high. I would be setting my stop loss just below the recent swing low to cut my losses if trade goes against me.
Alternate Scenario on Intraday Trade
- Trading is the game of probabilities and we can only forecast the next move but it does not mean that it will happen exactly. It can go against you and you must have a plan for an alternate scenario if trade goes against you. So, if you see the below chart, I have prepared my plan for an alternate scenario. If litecoin did not go up from here and continue its down move then I would be waiting for my buy entry on next liquidity zone around $190 and taking trade after confirmation on the break of structure as shown in below chart.
My Bias for Swing Trade
- Price has rejected twice from $230 area and I would be taking a buy from here as my swing trade. My swing trade profit target is the last All Time High price of $380. I would be taking profits just near that ATH. My stop loss area is just below the recent swing low to cut my losses.
- If price goes more down and break the current liquidity zone around $230 area then I would be waiting for my buy entry around next major liquidity zone around $160 area as marked in below chart.
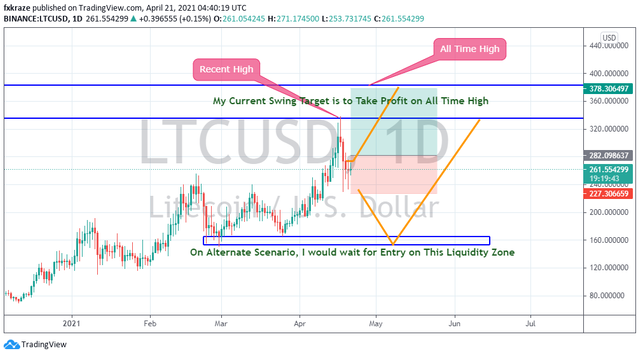
All Chart Images are Created using my Tradingview Pro+ Account
Final Words
Forecasting is the method of predicting the future moves of an asset and there are different types of methods.
We need price forecasting to know when to enter and when to exit from a trade. It also helps in reducing emotions while we are in trades because we know the levels and don't panic.
My favourite method of price forecasting is Technical Analysis and it gives you more opportunities to trade. It gives you more confidence and more chances to make profits. Technical analysis is easy to work with and it is a misconception among traders that it is hard to learn it.
I have explained my forecasting and trade plan on Litecoin for both intraday and swing trades. At the same time, I have also highlighted my plan for an alternate scenario. As a trader, we must trade, what we see and should not trade what we want. I hope you guys will understand my point of view and this will help you in your future trading.
I would like to pay my thanks to our Crypto Professor @stream4u for this wonderful lecture and looking to learn more in the coming weeks.
Hi @cryptokraze
Thank you for joining The Steemit Crypto Academy Courses and participated in the Week 10 Homework Task.
Your Week 10 Homework Task verification has been done by @Stream4u, hope you have enjoyed and learned something new.
Thank You.
@stream4u
Crypto Professors : Steemit Crypto Academy
Thank You for evaluating my task. I appreciate your suggestion of putting my usrname on chart. Will do in next tasks. Actually my tradingview username is being shown on top left of chart that is FxKraze but I got your point and will add my steemit username on charts.
Regards
If you say, I can add charts with my username now.
It is fine now. That was a part of a suggestion which you can implement from the next task.
well, You have explained each step comprehensively like a Professional trader. Is there any specific tool which can be used to predict the price?
I suggest learning about liquidity zones
wow, you explained everything very well.
Twitter Share
https://twitter.com/FxKraze/status/1384852471579910152?s=19
Very well @cryptokraze , you have explained very well and in a high manner