Crypto Academy / Season 3 / Week 3 - Homework Post by @chiwill
INTRODUCTION
When you talk about life you talk about the tendencies around it(i.e the trending things around it). Today each season comes with its trends and most times the thing(s) trending in a particular country is different from other countries.
Generally there are seasons when something becomes begins to increase like fashion style which could be short or long-term trends.
Trend is the increase of something or the inclination of something in a particular season or country which will neither be short or long-term. This is also a general direction that something is taking in a particular season at a given point of time.
NOW CONCERNING TREND IN CRYPTO MARKET.
Trend is the general direction that a market is taking at that particular period of time. It is a specific direction of a market price or asset's price in a specified period of time.
Now a trend is known by trend line or price action and a trend can be both upward and downward relating to bullish market (which indicates price increase) and bearish market (which indicates price decrease) respectively.
A trend can be marked up or down which is known as uptrend and downtrend in another word is called ascending trend and descending trend. When trends are marked by rising of data points such as higher swing high and higher swing low is known as uptrend. And when trends are marked by calling data points such as lower swing lows and lower swing highs is called downtrend.
NB: In trade chart nothing moves straight for long. So when there's increase in price in a given period of time is considered as uptrend and downtrend is the period of decrease in price they're vice versa.
🔸It gives the trader a specific price of an asset in the market.
🔸It is used to show trends in market price or asset's price over time.
🔸It helps the trader to take a technical analysis of a price based on the trendings.
🔸It gives a trader a clear understanding of the market price or chart.
🔸It gives a trader an accurate time of a trending or moving price of an asset.
🔸It helps the trader to set his/her market price.
This is one of the most tools used to know the direction or movement of price in market during a period of time by technical analyst.
Trend line is defined as a line drawn to show the direction of a trend at a given point of time. Trend lines are line drawn between two or more price pivot point which also forms the boundaries of price movements. The trend line are constructed in a chart by joining two or more price point with a straight line.
🔸It helps the technical analyst to identify and confirm trends in given period of time.
🔸It helps the trader to indicate the best fit of data by using a single line.
🔸 it helps the trader to predict and indicate support and resistance levels of a trend.
🔸 It helps the trader to determine the current direction in market prices.
🔸 It gives a clearer picture of trend in a chart.
Uptrend line and downtrend line are the two types of trends line in a chart which is also known as ascending trend line and descending trend line.
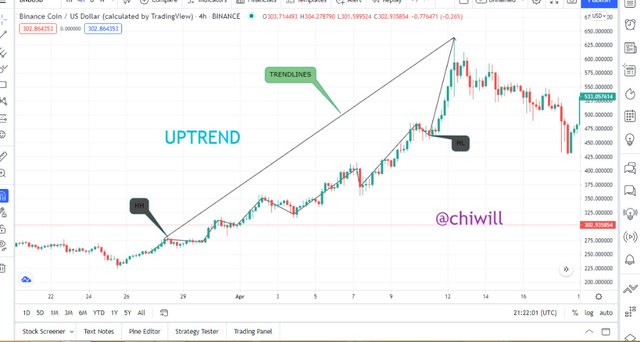 This chart is showing the uptrend line from the higher high to higher low.
This is formed by linking the lows where the more recent low price is higher than the previous low price. Which is considered as a level of support. It is also a general upward increase in price.
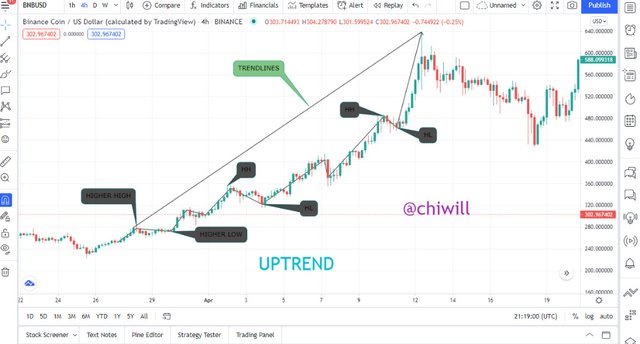 screenshot of uptrend chart
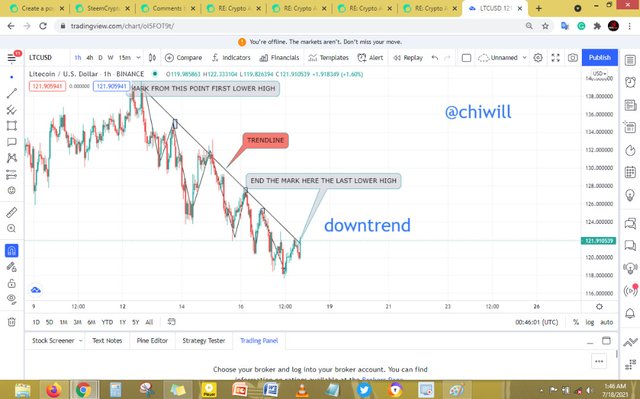 This chart is showing downtrend line from first lower high to last lower high.
This is the opposite of uptrend line. And it is a line formed by connecting the highs where the more recent high is lower than the previous high.
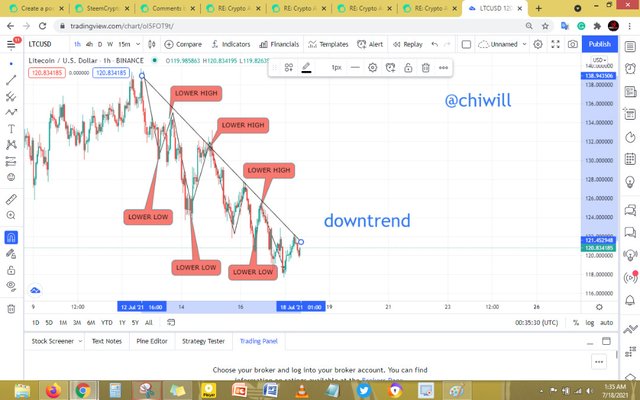 screenshot of downtrend chart
These are tools used to know the movement of price.
With the help of support and resistance levels the traders can be able to make decisions on the next trading.
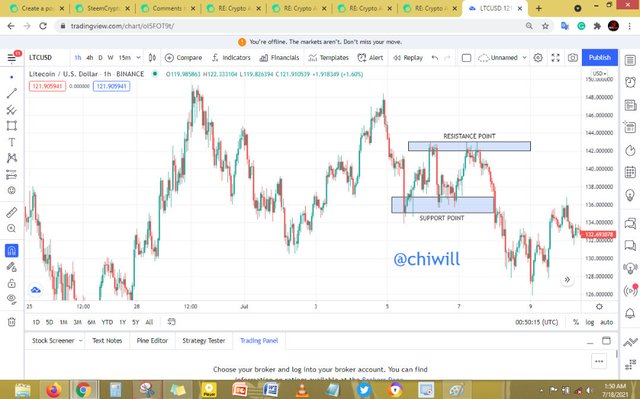 This chart is showing support line and resistance line
SUPPORT OR SUPPORT LEVEL:
This is a period of time when a price level of an asset does not fall below or it remains at that level for sometime. During this period of time buyers tries to purchase enter into stock.
RESISTANCE OR RESISTANCE LEVEL:
This level is formed when a securities price increases and then it rebound at a pivot point to aligns with at least two previous pivot point.
The double top and double bottom are the two simple chart patterns which will be a explain in this home work task.
Double top and double bottom are technical analysis traders use in trading.
DOUBLE TOP:
This is a pattern that traders use to highlight trend reversals. This pattern have or forms the shape of "M" in the chart price which is also known as bearish pattern.
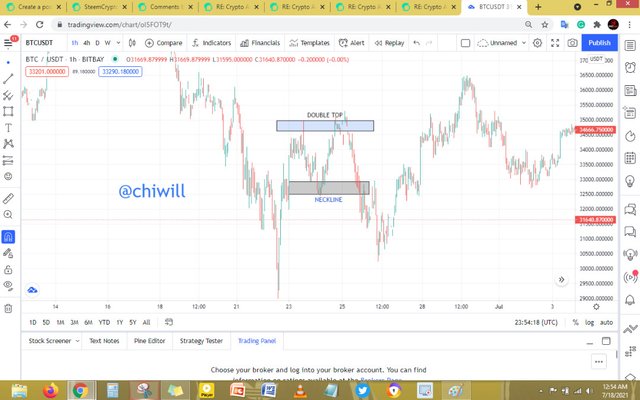 screenshot of double top chart
DOUBLE BOTTOM:
This chart pattern is used in describing a change in trend and it's reversal move is the from pervious leading price action. This pattern is the inverse of double top and it has a similar movement with double top. And it is the pattern that forms the shape of W which could be said to be bullish.
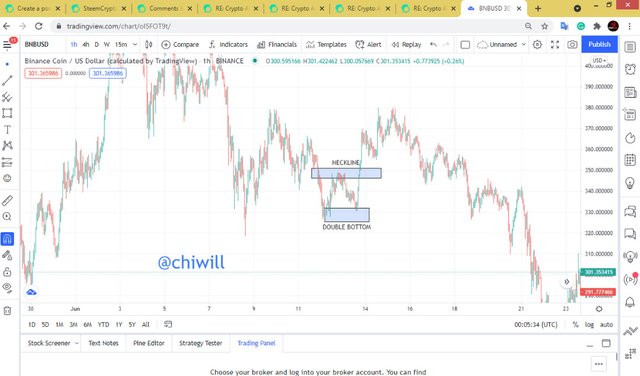 screenshot of double bottom chart
Trend gives the trader a clear understanding or information on the price movement of securities at given period of time. It gives trader the scope of the chart price.
Trend line helps the trader to take technical decision about the trends.
Thanks for reading.
@chiwill
Cc:@lenonmc21