Steemit Crypto Academy – Season 2 - Week 6 - Post for @kouba01

What is the MACD indicator
When it comes to technical analysis of any cryptocurrency asset, there are various tools and indicators that has proven to be very beneficial in determining the prices and movements in the cryptocurrency market. MACD indicator or a Moving Average Convergence Divergence is basically a type of technical analysis indicator that determines a new trend. MACD is a very popular and one of the most used type of indicators, it is also known as trend-following indicator. This type of indicator indicates the relationship between two moving averages. With this, the MACD helps to determine the market trend direction. Basically, what the MACD indicator does is that it compares two EMAs or Exponential Moving Averages and shows the difference between the fast and slow Exponential Moving Averages. On tradingview, the MACD indicator shows the MACD blue line and the signal orange line.
Is the MACD Indicator Good for Trading Cryptocurrencies?
In my opinion, the MACD is a great indicator for cryptocurrency trading. We all know that the cryptocurrency market is very volatile and comprises of a lot of trends. With the MACD indicator a trader or investor can predict what the next trend will be. This will give the trader or investor an insight on when to buy or sell a particular cryptocurrency.
MACD or RSI which is better?
Both MACD and RSI are all very good indicator because they can help determine when to buy or sell a particular cryptocurrency. In my opinion, both should be used together when trying to predict the market trends more accurately. The MACD helps to determine the trends in the market while RSI helps to indicate the overbought and oversold situations in the market. Both are quite similar because an overbought situation in the market can be interpreted as an upward trend while an oversold can be interpreted as downward trend. A lot of traders and investors like to buy at the bottom of the downward trends and sell at the top of the upward trends.
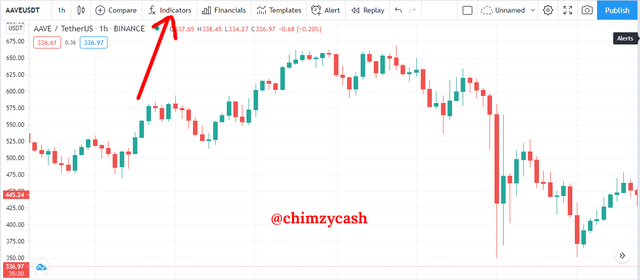
How to add the MACD indicator to the chart
Adding the MACD indicator on any cryptocurrency chart is quite easy to do with trading view.
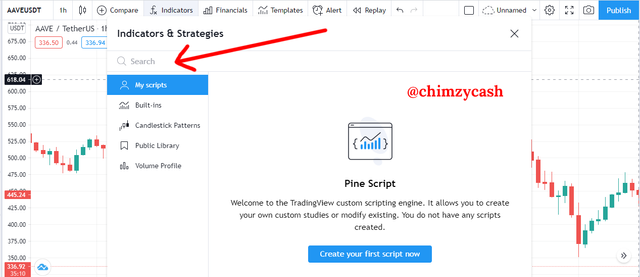
- Go to tradingview and click on the indicators tab
.png)
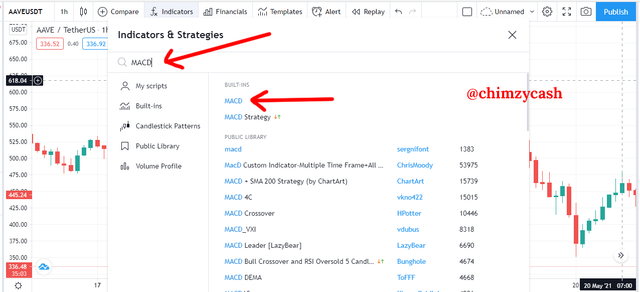
- On the search, search for MACD
.png)
- Select the first one written only MACD
.png)
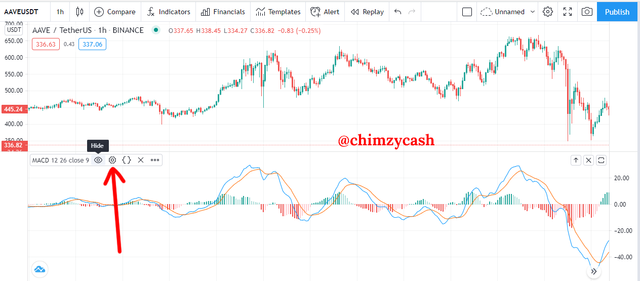
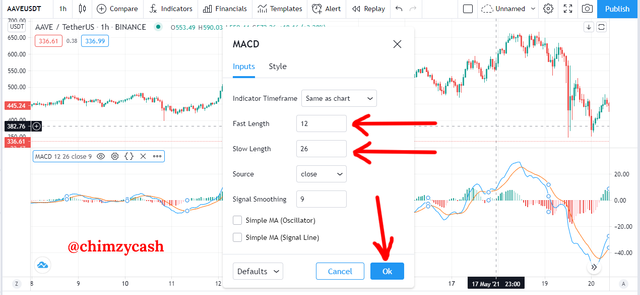
- Click on the MACD area and click on the settings icon
.png)
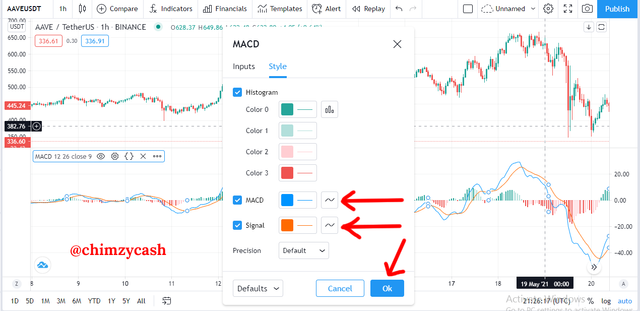
- On the MACD settings, you can change the inputs and also the styles depending on your needs.
.png)
.png)
How to use MACD with crossing MACD line and signal line?
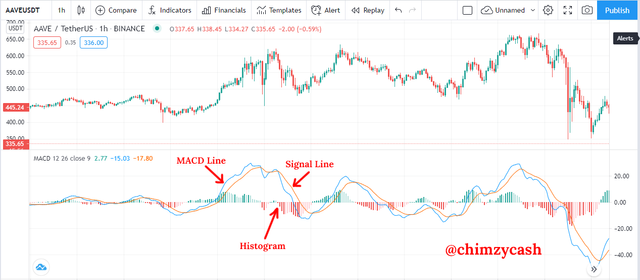
After adding the MACD indicator to the chart, click on the settings icon, go to the styles section to know the colours of the lines and what they represent. Based on my settings, the MACD line shows blue and the signal line shows orange line. The histogram bars becomes red when the MACD line goes below the zero line and green when the MACD line goes above the zero line. What the histogram does is that is displays the difference between the MACD line and the zero line.
.png)
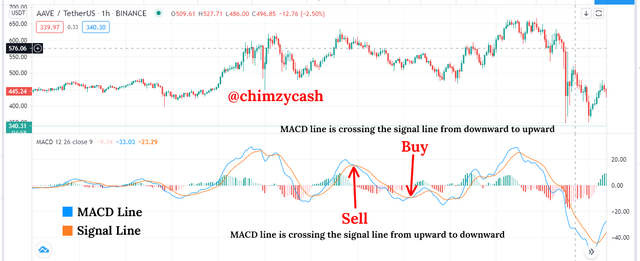
To make use of the MACD indicator with crossing MACD line and signal line, you have to carefully look out for section where the MACD line crosses the signal line from a downward to upward. When this happens, it is a good buy signal or indication to buy or enter the trade. In contrast, if there is a situation where the MACD line crosses the signal line from upward to downward, it becomes a good sell signal or indication to sell or exit the trade.
.png)
How to use the MACD with the crossing of the zero line?
To make use of the MACD with crossing pf the zero line, you have to carefully look out for section where the MACD line crosses the zero line and continues in an upward movement, then it is a good buy signal or indication to buy. In contrast, when the MACD line crosses the zero line and continues in a downward movement, then it is a good sell signal or indication to sell.
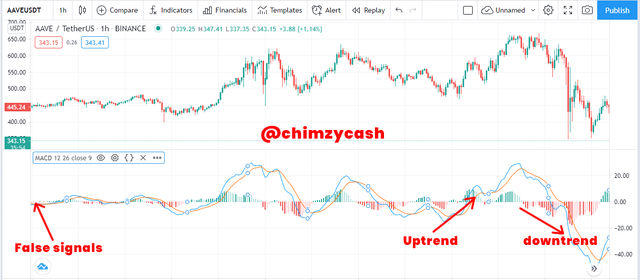
How to detect a trend using the MACD and Filtering out false signals?
Detecting a trend using the MACD is basically by looking at the histogram bars to see the color and movement. The histogram bars will show the market trends either uptrend or downtrend by displaying the colors and direction of trend movement. Filtering out false signals is basically by looking out for sections where the Histogram displays very tiny and faint bars.
.png)
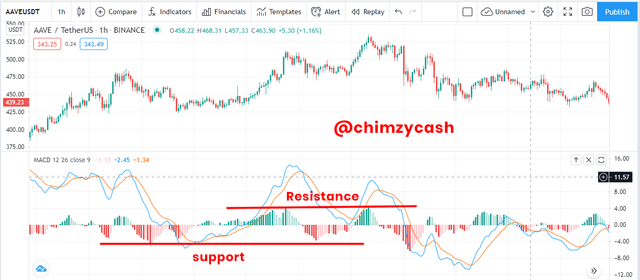
How can the MACD indicator be used to extract points or support and resistance levels on the chart?
From the histogram on the chart, we can see where the downtrend below the zero line forms the support level and where the uptrend above the zero line forms the resistance level
.png)
Review the chart of any pair
.png)
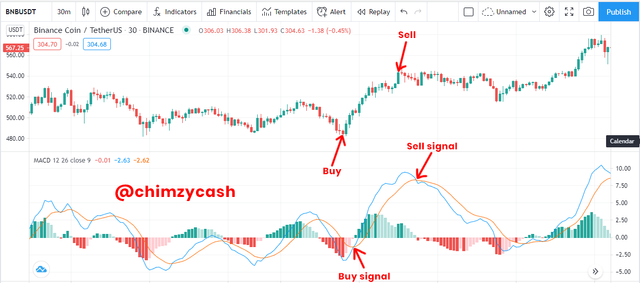
BNB/USDT chart
For this demonstration, I will be using the BNB/USDT pair to demonstrate the different MACD signals. From the chart, we can see the best positions to buy and sell from the MACD indicator. This is one of the main benefits of the MACD indicator because it helps an investor or trader determine the market trends so as to know when to buy or sell in order to capitalize on the market fluctuations and make the most profit.
Hi @chimzycash
Thanks for your participation in the Steemit Crypto Academy
Feedback
This is just average work done. Your article is too short and lacking in-depth details regarding the usage of the MACD trading indicator. Kindly put more effort into your work.
Homework task
5