[Crypto Trading with Moving Average] - Steemit Crypto Academy | S6W2 | Homework Post for professor @shemul21
It is another special week to make my contributions as required in the SCA community. I will be engaging the task given by professor @shemul21 on Crypto Trading with Moving Average. Relax and read through.
Question 1: Explain Your Understanding of Moving Average
This is one of the commonly used trading tools by investors/Traders while persecuting their orders in any given chart analysis. It takes into account the different averages of all data collected in the data points. This observed arithmetic means calculation in Moving Averages help in smothering out the price which hence gives a smoother signal.
While calculating Moving Averages, this helps in removing the market noise and insignificant market effects are removed. It is a trend-based indicator that helps in identifying trend direction and also supports resistance levels. Due to its historical use of past prices, it is most times a lagging indicator. Hence the creation of the different types of moving averages in order to reduce lag.
It is a very flexible technical indicator that allows users to set their periods/time frame according to their priority. But shorter periods are known to be more sensitive than longer periods. Longer periods are less reactive to market effects as most little and insignificant noises are neglected.
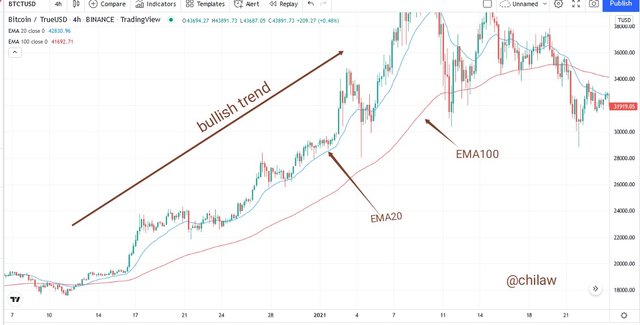
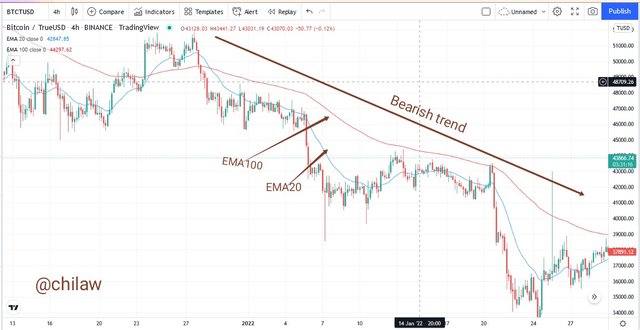
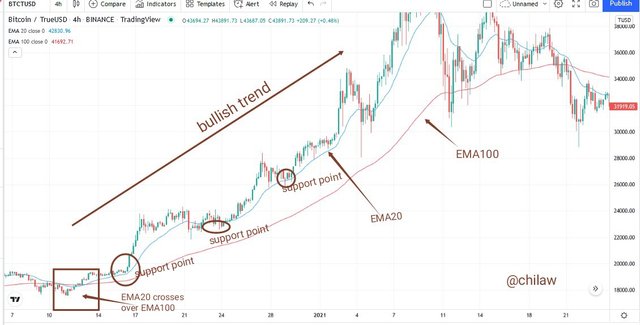
When the Moving Average indicator line is in the upward direction, this shows an Uptrend in the market. And when it is seen in the downward direction, it is on a downtrend.
Under the Moving Average indicator, we have advancements done to bring efficiency and better performance of use. They include;
- Simply Moving Average (SMA)
- Exponential Moving Average (EMA)
- Weighted Moving Average (EMA)
- Triple Exponential Moving Average (TEMA)
Question 2: What Are The Different Types of Moving Average? Differentiate Between Them.
SIMPLE MOVING AVERAGE (SMA)
Just as the name denotes, it is calculated by taking into account the arithmetic mean of all given values relative to the set period. Just like the way we calculate the mean of a set of numbers by diving it by the number of the set values. One key feature about the SMA is that it takes into consideration all subnets that make up the entire data points into consideration before arriving at its average.
It is calculated by;
SMA = ( Average 1 + Average 2 +... Average n)/n
Where;
Average 1+2+n = Average in "n" periods
n = Period in "n" times
EXPONENTIAL MOVING AVERAGE (SMA)
The EMA is also another type of moving average a little skewed from the SMA. One distinctive feature about it over the SMA is that it reduces lagging more than what is obtainable I. The SMA. Also, it does not take into consideration all the individual subnets that make up the data points while calculating the average price value instead it gives more emphasis to recent prices only.
Because of the fact that it uses only recent prices while calculating the average price value, the EMA responds to price changes faster than the SMA. And this in extension makes it fall in price faster than the SMA because it rises more during an Uptrend.
EMA = [EMA valued today x (s/1+d) + EMA valued yesterday x (s/1+d)]
Where;
s = smoothing factor
d = number of n days
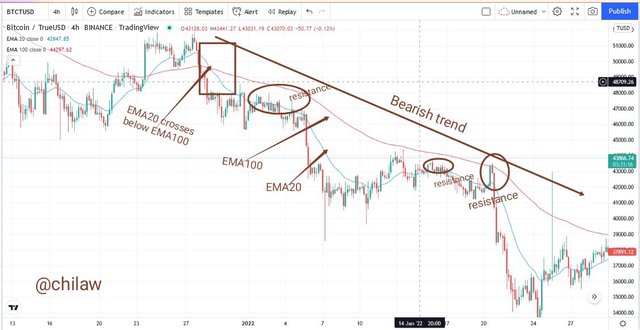
Question 3: Identify Entry and Exit Points Using Moving Average. (Demonstrate with Screenshots)
In identifying entry and exit points while using the Moving Average, two EMAs needed to be combined in a chat analysis. In simple terms, a short and long-term frame EMA would be set and their positions relative to the price trend.
When the shorter period EMA crosses above the longer period but serves as a support to the trend line, then we have an Uptrend where price trend is observed in an upward direction.
When the shorter period EMA crosses below the longer period but serves as a Resistance to the trend line, then we have a downtrend where the price trend is observed in a downward direction.
Question 4: What do you understand by Crossover? Explain in Your Own Words.
Crossover is one of the trading signals that occur in Moving Averages (MA) irrespective of the type of moving averages. It comes as a result of the combination scenario of two moving averages (SMA, EMA, TEMA ) in a Chart analysis.
When two Moving Averages are combined today, short and long time period settings, it is expected that this duo is observed at a point where they cross each other. This crossover may occur within an Uptrend scenario or in a downtrend scenario or where the shorter period crosses above or below the longer period Moving Average line.
When the crossover happens when the shorter period settings cross above the longer period settings of the Moving Average, we can say it is an Uptrend scenario. The shorter period settings also serve as a support to the trend line.
When the crossover happens when the shorter period settings cross below the longer period settings of the Moving Average, we can say it is a Downtrend scenario. The shorter period settings also serve as a Resistance to the trend line.
Question 5: Explain The Limitations of Moving Average.
Frequency of change of the average value of price due to the update and emergence of recent price. This makes trend prediction a long task
Situations where the weight of calculation of average prices are on most recent data, this neglects little signals therein in the market.
Signals are delayed when trends show some of these signals. Hence, it is a lagging indicator that doesn't give signals immediately relative to price action.
It leaves traders to choose the best time frame suitable for engaging trade as there is no perfect best for anyone
there are incidences of false signals given to the indicators' quick nature to respond to trend action in a short period.
Conclusion
The Moving Average is one of the commonly used indicators as well a trend-based indicator. It is a very flexible indicator that allows users to set their periods/time frame according to their priority and what best serves them in profiteering. It uses the arithmetic mean of data points or most recent prices in determining the average price of a given asset.
Thank you professor for your lectures.