Chaikin Money Flow Indicator - Crypto Academy / S4W6 - Homework Post for [@kouba01]
Hello Steemians!
Hope you all are performing well in Steemit Crypto Academy and enjoying the various courses. Here I am submitting my assignment for the lesson about Chaikin Money Flow Indicator. I hope my assignment will be up to the required standard.
1. In your own words, give a simplified explanation of the CMF indicator with an example of how to calculate its value?
Chaikin Money Flow Indicator (CMF)
Named after its developer Marc Chaikin, this Chaikin Money Flow Indicator (CMF) is a type of oscillator indicator. Not only its shows the market trend but also indicates the market strength as it is a volume-based indicator.
CMF measures the flow of money in and money out for a specified period of time. The default period 21 was suggested by its inventor but the 20 periods are commonly used in the charts.
The indicator generated oscillates below or above the 0 lines. Above 0 is considered a bullish trend while below 0 indicates a bearish trend but it is not advisable to use this indicator alone to determine the trend rather it is more useful to measure the strength of the market.
Calculation of CMF indicator
It can not be calculated directly using price and volume, first requires to the calculation of different parameters. The formula to calculate CMF indicator is -

The first step is to determine each period’s money flow multiplier as follows:
Money Flow Multiplier = [(Close - Low) - (High - Close)] /(High - Low)The next step is to calculate the volume of money flow as follows:
Money Flow Volume = Money Flow Multiplier x Volume for the Period
Now let's calculate using some data
The high price of the period = 25.83
Low price of the period = 23.75
Closing of the period = 24.65
The volume of the period = 236000
The total volume of the n period 2351000 OR the average volume of 20 periods = 117550
On the basis of the above data, the Money flow multiplier (MFM) of the period will be -
= [(24.65 - 23.75) - (25.83 - 24.65)]/(25.83 - 23.75)
= (0.9 - 1.18)/2.08
= - 0.13
Now we will calculate Money flow volume (MFV) on the basis of the above data and MFM
= MFM x Volume of the period
= - 0.13 x 236000
= - 30680
This figure - 30680 is for a single period. If we sum for the last 20 periods it will be a different value.
Let's assume the sum of 20 periods is 501200 (it is positive) and the average of 20 periods is 25060
Now according to the formula, CMF = sum of 20 periods MFV/total volume of 20 period
In the formula, we also can use the average for both MFV and volume instead of the sum as it won't affect the value
therefore CMF indicator will be
= 25060/117550
= 0.21 (+)
The positive value shows a bullish trend.

2. Demonstrate how to add the indicator to the chart on a platform other than the tradingview, highlighting how to modify the settings of the period(best setting).(screenshot required)
Applying indicator on the chart
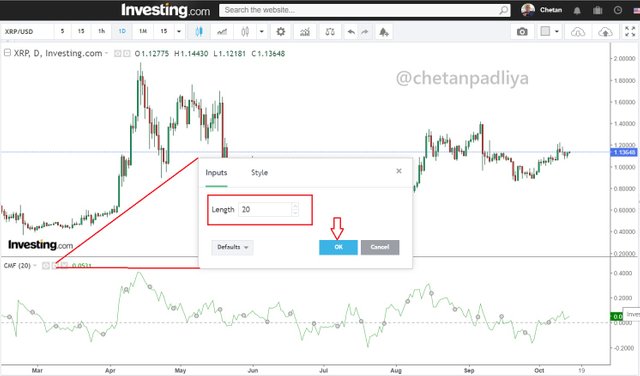
For this task, I will use https://www.investing.com/. landed on the site and open cryptocurrency-charts
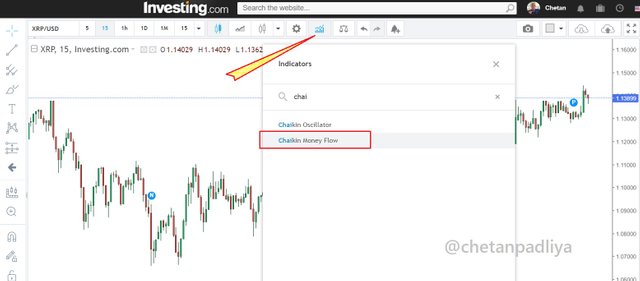
Clicked on the indicator icon as shown in the above screenshot and searched for Chaikin Money Flow. Selected the indicator.
Now click on the setting of the indicator a popup window opens. there are 2 variables that can be changed. Input and style. For input default period setting is 20 I kept it as default. For style, I also kept it default.
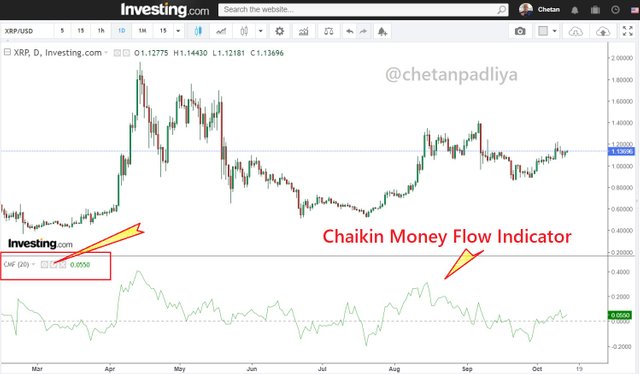
Best setting for indicator
The inventor of the indicator suggested 21 periods for the best but on the chars default is 20 periods. In general 20 and 21, both are used for analysis.
It can be changed for higher or lower periods but selecting the higher period. Here I set for 20,40 and 10 periods and we can see the difference clearly.
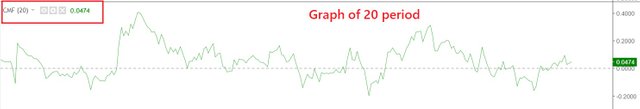
- In the 20 periods setting it moves frequently above or below 0, which means gives signals frequently
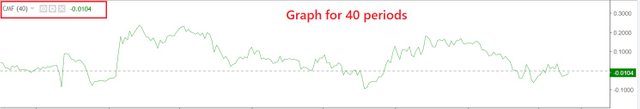
- In the 40 periods setting it, spend more time above or below 0 and frequencies of signals reduces.
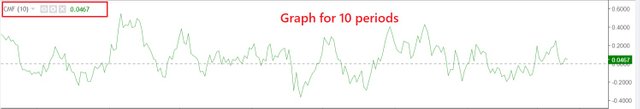
- In 10 periods setting signals are very frequent.
It is clear from the above comparison that the higher the periods lesser will be the signals but signals are more reliable. At 20 periods signals are not so frequent but considered reliable so this is a default setting. At 10 periods signals are very frequent and noisy and not much reliable.
3. What is the indicator’s role in confirming the direction of the trend and determining entry and exit points (buy/sell)؟(screenshot required)
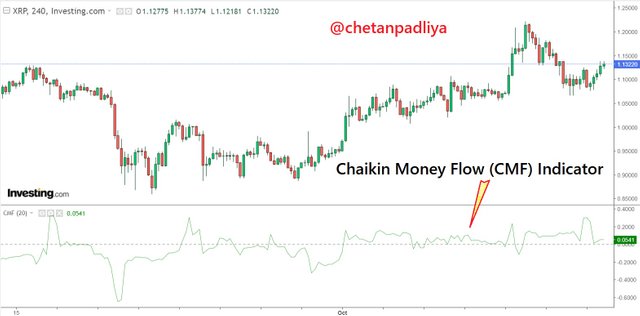
The CMF indicator is easy to read as above value 0 it shows uptrend and below 0 it shows downtrend. Generally, it moves in between +0.5 and -0.5. Above +0.5 shows the extreme buying pressure while below 0.-5 is extreme sell pressure.
Entry - When CMF started to move above 0 from the negative zone and at the same time price movement is also in the uptrend that could be an entry point.
Exit - When CMF started to move below 0 from the positive zone and price movement is also downward then it indicates the bearish trend and exit can be taken at that point.
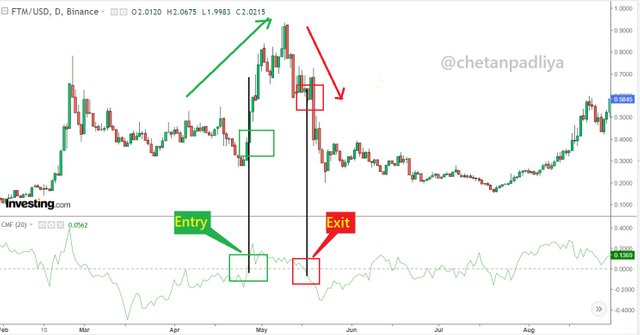
In the above screenshot, it is observed that CMF is moving from the negative to the positive zone and the price is also moving up. In such a situation above 0 can be considered as an entry point.
Similarly as observed in the chart above when CMF indicator is moving from negative to the positive zone and price movement is also in a downward trend then below 0 levels can be considered an exit point.
4. Trade with a crossover signal between the CMF and wider lines such as +/- 0.1 or +/- 0.15 or it can also be +/- 0.2, identify the most important signals that can be extracted using several examples. (screenshot required)
As discussed earlier the CMF indicator oscillates above and below 0 and above 0 is considered as an upward trend while below 0 is a downward trend. But it crosses the 0 levels several times even in a 20-period setting. If a trader follows the signal of above and below 0 levels to trade it could be difficult as he needs to open and close the position frequently.
In the above chart, it is observed that the indicator is moving above and below 0 levels frequently. Now I drew two lines at +0.1 and at -0.1 as shown in the below screenshot.
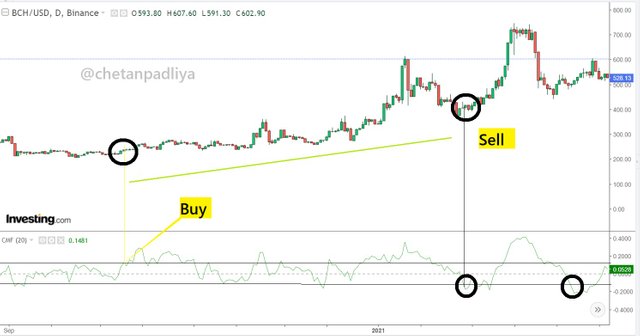
Now if a trader initiates a trade when the indicator going up from below 0 levels and crosses the +0.1 line he can stay in the trade for a long time until the indicator goes down from above 0 levels and crosses the -0.1 line.
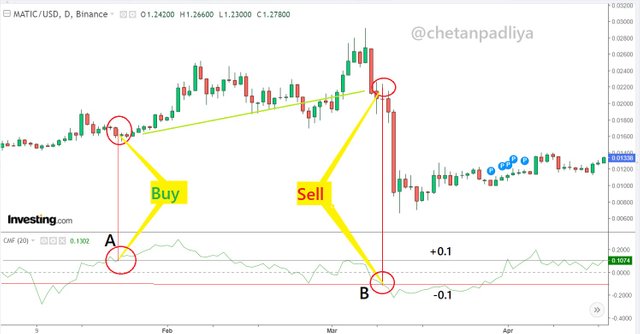
In the above screenshot at point A, the indicator goes up from the negative zone to the positive zone and crosses the +0.1 line so A is considered as a buy entry point. At point B indicator fall from positive zone to negative zone and break the -0.1 line to go downward. Point B is considered a Sell point.
If a buy trade would have been initiated at point A and squired off at point B, it would have been a profitable trade.
5. How to trade with a divergence between the CMF and the price line? Does this trading strategy produce false signals?(screenshot required)
The divergence phenomenon is observed when the oscillator indicator and price action moves in the opposite direction. Like any other oscillator indicator, CMF also shows divergence sometimes on the chart. There can be bullish as well as bearish divergence.
Bullish divergence
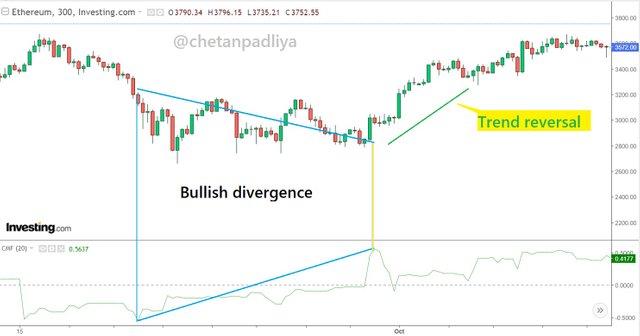
In the above chart, a bullish divergence is observed as the price graph is going down while the CMF indicator is moving upward. Both are in the opposite direction. This indicates the weakening of the trend and a trend reversal is possible. A trade can be initiated to keep in mind this possible trend reversal with the help of other indicators.
Trade setup
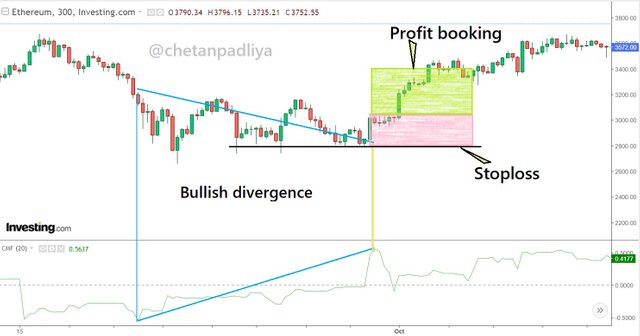
As the bullish divergence is the indication of the weakening of bearish trend a buy entry trade can be set up in the anticipation of a trend reversal in an upward direction. In the above chart when the CMF indicator was at about 0.5 and started to move down, at the same time a trend reversal is also observed in the price movement. A support line is drawn on the nearest lower low and buy entry can be initiated with a stop loss near to support level. The profit booking ratio can be decided on either 1:1 or 1:2 depends on risk-taking capacity.
Bearish divergence
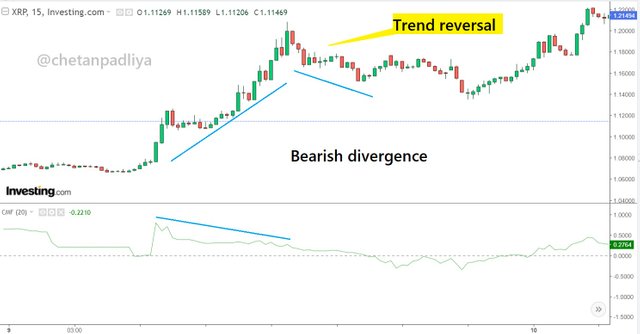
As seen in the above chart it is the situation just opposite to the bullish divergence. Here price movement is in the upward direction while at the same time the CMF indicator is moving downward direction. This also shows the weakening of the upward price movement and a trend reversal is expected.
Trade setup
Bearish divergence is the indication of the weakening of bullish trend and so a sell entry trade can be initiated in the anticipation of trend reversal with proper stop-loss near the resistance zone
6. Conclusion
Chaiken Money Flow is a volume-based oscillator indicator that shows the strength of the market in the bullish as well as in bearish trend. It also indicates the trend of the market. The indicator moves above or below the 0 line and shows the trend accordingly.
Using CMF alone for trend identification is not a good idea as there are possibilities of false signals also. This indicator can be used to confirm the trend with another indicator.
The calculation of CMF is a little bit complex but overall it was a nice experience to learn about the calculation of CMF indicators.
For trading purposes default setting is 20 periods but with experience and the trading time frame, it can be increase or decrease. Increasing periods gives signals less frequent and some trading opportunities can be missed, on the other hand, decreasing periods below 20 gives signals very frequent that increases the possibilities of false signals.
Overall it is a very effective indicator to determine the strength as well as the trend of the market.
Thank you Prof. @kouba01 for such an insightful and interesting lesson.


Hello @chetanpadliya,
Thank you for participating in the 6th Week Crypto Course in its 4th season and for your efforts to complete the suggested tasks, you deserve a Total|8.5/10 rating, according to the following scale:
My review :
Work with good content, because you take every question seriously. Here are some notes:
A non-detailed explanation of the CMF indicator with all its features. Contrary to the excellent example of his arithmetic method, which was evident in all its stages. It was possible to add your opinion of the result obtained.
You did not go into depth in answering the second question.
Most of your answers were successful, with just what is required. Only the last question could have been expanded further in its second part.
Thanks again for your effort, and we look forward to reading your next work.
Sincerely,@kouba01
Thank you Prof. for your valuable feedback and suggestions!