[ENG - ESP] Crypto Academy Week 2 Homework Post for [@stream4u]
English
Hello everyone! I hope you all are okay! Here in Argentina there are 5 minutes left until the end of February 21, I hope this task enters !! I can't say hello better! Greetings and thanks for reading!!
1- The green and red candles are indicators of the increase or decrease in the price of the cryptocurrency that we are analyzing. The green ones indicate that the price is increasing, it is a moment of rising. Reds, on the other hand, indicate that the coin is losing value. These candles can be longer depending on the amount of increase or decrease in the price and can represent different time frames, from 5 minutes to 1 month.
2 - The times in which we can observe the fluctuations of the currency are 1 minute, 3 minutes, 5 minutes, 15 minutes, 1 hour, 2 hours, 4 hours, 6 hours, 8 hours, 12 hours, 1 day, 3 days, 1 week, 1 month.
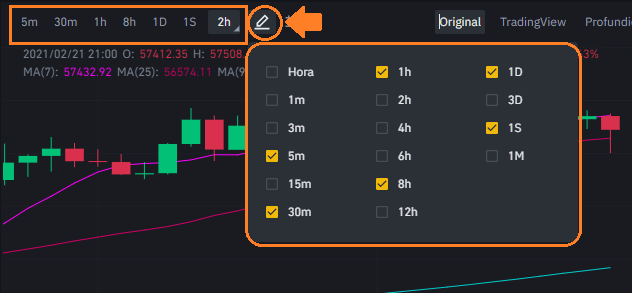
By clicking on the editing pencil, you can see all the price options that there are, and configure the ones you want to leave fixed. The ones you choose will depend on the type of trader you are. However, you can check any of the other times whenever you want.
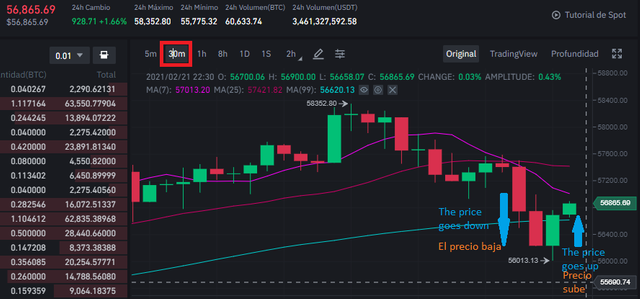
It's necessary to change the analysis time to obtain a more concrete look at what is happening since a red candle in 5 minutes of time could indicate that there is a decrease in price, but that single glance could lead us to a wrong conclusion As if the 15 minute, 1 hour or 4-hour candle is analyzed, we could see that the price is actually going up, and that red candle only shows a small low at that moment. That also depends on what type of trader you are.
3- I have taken two charts that I edited in part on the Binance page, in the trading vision, which allows marking all these things, and another part in Paint. I took a 15 minute time frame and a 1-day time frame for the DOT / USDT pair.
DOT / USDT pair, 15-minute chart
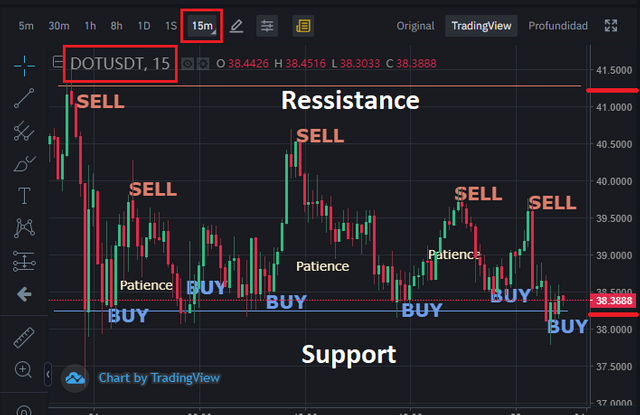
It is observed that in a period of 15 minutes there are several moments in which it could be bought and sold, but the price ranges approximately between 38,000 and 41,200. There are a lot of times when you have to be patient and just wait, as certain values are held for longer periods of time until they go down or up again.
DOT / USDT pair, 1 day chart
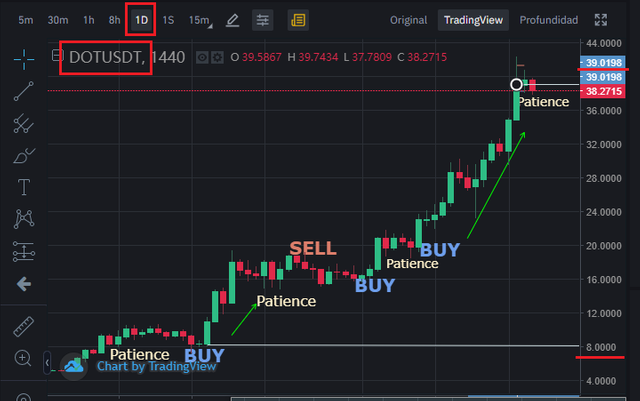
The 1-day chart is very different. If there is a long-term trader, he or she clearly benefited from this, and perhaps much more than a short-term one, since patience paid off. DOT has been on the rise almost constantly over the days, beyond any fluctuations that may have occurred in shorter periods of time. However, there were also moments of the greater stability of the value, where the trader will have had to wait and it is observed that right now there is a red candle for this day. Perhaps I am wrong in my conclusion because I am very new to this, but I think that the trader should wait, as judging by the dynamics of previous days, these small lows are normal, and then it is likely that it will continue to rise.
4- There are three types of traders in the market: short-term, long-term, and scalping. The first are those who buy and sell cryptocurrencies in 24-hour periods, wait for the profit in that time, and withdraw. The long-term ones are more than one day, they can be several days, weeks, months, or years, and they are benefited by the increase in the value of the currency in all that time, taking into account the initial and final investment, resulting from have left their cryptocurrencies there and patiently wait for it to rise in the long term.
The term scalping is for those who buy and sell cryptocurrencies in very short periods of time, surely less than a day, but it is probably less than 5 minutes or less, and they simply wait for the profit of that small fraction of time; they are supposed to have a large amount of money for these operations to be truly profitable.
In my case, I identify more with short-term traders, but it has only been 2 or 3 weeks since I started with this, so I don't consider myself a trader yet.
5- Support and resistance give us a general reference to turning points in corners. Support means the lowest moment it was the previous time, and therefore we can expect it to maintain that level, so it is a good point to buy. Resistance, on the contrary, indicates the highest value of the cryptocurrency, so we could speculate that from there, it will go down, this is the time to sell. It is essential in trading, as it is one more tool to speculate when to buy and sell.
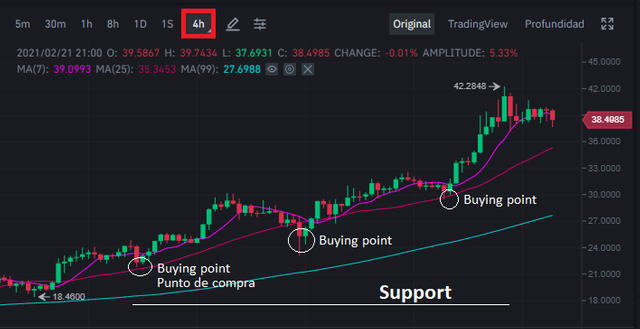
6- You can find support by looking at a chart of 5 minutes a day, and in this case, I marked it for the one used in one of the previous points.
In this 5-minute chart, both the low and high curves can be seen quite clearly. All those curves that are downward, from which the price begins to rise, initiate support.
7- After finding support, we should buy when the price starts to rise.

I hope you understood and enjoyed it! Thanks for this class! it has really been very useful for me !!
Greetings,
Belen
DC-
@steemitblog
@steemcurator01
@steemcurator02
@stream4u
@stephenkendal
.png)
Español
Hola a todos! Espero que estén muy bien! Acá en Argentina faltan 5 minutos para que termine el 21 de Febrero, espero que esta tarea entre!! No alcanzo a saludarlos mejor! Saludoss!
1- Las velas verdes y rojas son indicadoras del aumento o disminución del precio de la criptomoneda que estemos analizando. Las verdes indican que el precio está en aumento, se trata de un momento d alza. Las rojas, por otra parte, indican que la moneda está perdiendo valor. Estas velas pueden ser más largas dependiendo de la cantidad de aumento o descenso que haya habido en el precio, y pueden representar diferentes fracciones de tiempo, desde 5 minutos a 1 mes.
2- Los tiempos en que podemos observar las fluctuaciones de la moneda son 1 minuto, 3 minutos, 5 minutos, 15 minutos, 1 hora, 2 horas, 4 horas, 6 horas, 8 horas, 12 horas, 1 día, 3 días, 1 semana, 1 mes.
Haciendo click en el lápiz de edición, podés ver todas las opciones de precios que hay, y configurar las que deseas dejar fijas. Las que elijas dependerán del tipo de trader que seas. Sin embrgo, podés chequear cualquiera de los otros tiempos cuando lo desees.
Es necesario cambiar el tiempo de análisis para obtener una mirada más concreta de lo que está ocurriendo, ya que una vela roja en 5 minutos de tiempo, podría indicar que hay un descenso en el precio, pero esa sola mirada podría llevarnos a una conclusión errónea, ya que si se analiza la vela de 15 minutos, 1 hora u 4 horas, podríamos ver que el precio en realidad está subiendo, y esa vela roja solo muestra una pequeña baja en ese momento. Igualmente eso depende de qué tipo de trader seas.
3- He tomado dos gráficos que edité en parte en la página de Binance, en la visión para trading, que permite marcar todas estas cosas, y otra parte en Paint. Tomé un período de tiempo de 15 minutos y otro de 1 día para el par DOT/ USDT.
Par DOT/ USDT, gráfico de 15 minutos
BUY: Comprar
SELL: Vender
Patience: Paciencia
Se observa que en un período de 15 minutos hay varios momentos en los que se podría comprar y vender, pero el precio oscila aproximadamente entre 38.000 y 41.200. Hay una gran cantidad de momentos en los que hay que tener paciencia y simplemente esperar, ya que se mantienen ciertos valores por períodos más prolongados, hasta que bajan o suben nuevamente.
Par DOT/ USDT, gráfico de 1 día
El gráfico de 1 día, es muy diferente. Si hay un trader de largo plazo, claramente se vio beneficiado con esto, y quizás mucho más que uno de corto plazo, ya que la paciencia, trajo sus frutos. DOT ha estado en aumento de manera casi constante al pasar los días, más allá de las fluctuaciones que pueda haber presentado en períodos más cortos de tiempo. Sin embargo, también hubo momentos de mayor estabilidad del valor, en donde el trader habrá tenido que esperar y se observa que ahora mismo hay una vela roja para este día. Quizás me equivoque en mi conclusión, porque soy muy nueva en esto, pero creo que el trader debería esperar, ya que a juzgar por la dinámica de días anteriores, estas pequeñas bajas son normales, y luego es probable que continúe subiendo.
4- En el mercado hay tres tipos de traders: a corto plazo, a largo plazo y scalping. Los primeros son aquellos que compran y venden criptomonedas en períodos de 24 horas, esperan la ganancia en ese tiempo y se retiran. Los de largo plazo están más de un día, pueden estar varios días, semanas, meses o años, y se ven beneficiados por el incremento del valor de la moneda en todo ese tiempo, teniendo en cuenta la inversión inicial y la fnal, resultante de haber dejado sus criptomonedas allí y esperar pacientemente la suba a largo plazo.
El térimino scalping, es para aquellos que compran y venden criptomonedas en períodos muy cortos de tiempo, seguro que menor a un día, pero probablemente sea menor a 5 minutos o menos, y simplemente esperan la ganancia de esa pequeña fracción de tiempo; se supone que tienen una gran cantid de dinero para que esas operaciones sean verdaderamente rentables.
En mi caso, me identifico más con los traders de corto plazo, pero hace tan sólo 2 o 3 semanas que he empezado con esto, así que no me considero trader aún.
5- Soporte (support) y resistencia nos dan una referencia general de momentos de inflexión en las curvas. Apoyo significa el momento más bajo que estuvo la vez anterior, y por lo tanto podemos esperar que mantenga ese nivel, por ello es un buen punto para comprar.
Resistencia por el contrario, indica el valor más elevado de la criptomoneda, por lo que podríamos especular que a partir de allí, bajará, este es el momento para vender. Es fundamental en trading, ya que es una herramienta más para especular los momentos de compra y venta.
6- Podés encontrar el soporte observando un gráfico de 5 minutos a un día, y en este caso yo lo marqué para el utilizado en unon de los puntos anteriores.
En este gráfico de 5 minutos se observan con bastante claridad las curvas tanto de bajas como de altas. Todas aquellas curvas que están hacia abajo, a partir de las cuales el precio empieza a subir, inican el support.
7- Después de encontrar el soporte, deberíamos comprar cuando el valor empieza a subir.
Espero que se haya entendido y lo hayan disfrutado! Gracias por esta clase! realmente ha sido muy útil para mí!!
Saludos,
Belén
Cc-
@steemitblog
@steemcurator01
@steemcurator02
@stream4u
@stephenkendal

Thank You For Showing Your Intrest in Steemit Crypto Academy
You have completed the homework task and made a good post, explained very nicely about How To Read Candlestick Charts In Different Time Frame & Information about Buy-Sell(Support &
Resistance).
Remark: Homework Task Completed.
Thank You.
@stream4u
Crypto Professors : Steemit Crypto Academy
#india #affable
Thank you very much!! :) :)
Thanks for promoting Steem by sharing you post on twitter
( If you no longer want to receive notifications and upvotes from us, reply to this comment with the word
STOP)Shared on Twitter
Shared on Facebook
#promo-steem #postpromotion #steemit