Puria Method Indicative Strategy- Steemit Crypto Academy- S5W4-Homework post for @utsavsaxena11. "

Welcome once again to another wonderful episode in the crypto Academy community. Before I present my homework post, I would like to acknowledge the professors and the crypto Academy community for making such an educative lecture possible. Today’s topic is simple Trading With Puria Method Indicative Strategy
Without wasting enough time I would present my homework post systematically based on the questions from the professor @utsavsaxena11.

1. Explain Puria method indicative strategy, what are its main settings. which timeframe is best to set up this trade and why? (Screenshot needed and try to explain in detail)
Crypto trading has become the order of the day. Traders in the ecosystem are strategizing ways to maximize their profit. Both scalpers and swing traders have different strategies they are both using. Today, we would learn one effective strategy to improve our trading skills.
The Puria method is one of the most used technical strategies by traders in the crypto ecosystem. This strategy combines the use of three technical indicators just to confirm 1 trade signal. The strategy is more like making a vivid confirmation since three indicators are used to perfect one trade signal.
The Puria method uses two weighted moving averages with specific settings and The MACD indicator also with specific settings. The MACD indicator is used as a confirmation when signals pop up from the chart.
With this method, the moving average acts as support and resistance levels where the price usually bounces off when there’s a trend in the market.
Settings Required for Puria Method
As I said earlier, the method requires the use of three different indicators. However, the default settings of these indicators wouldn’t be of any good if indeed we want to specifically use the Puria method.
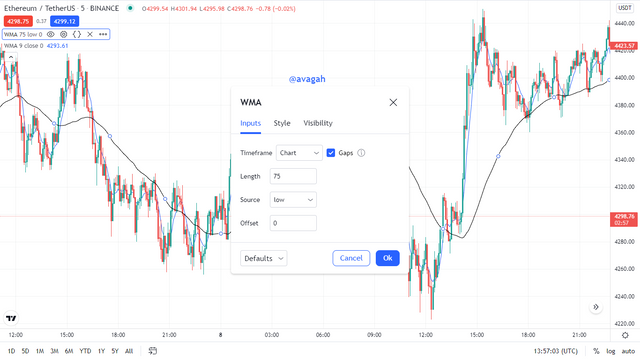
With the first moving average, after adding the indicator on tradingview, we alter the settings to 75 period for the length and Low for the source. In any case, we usually don’t prefer the use of either Red or green color for the indicator since it may blend with the candlesticks.
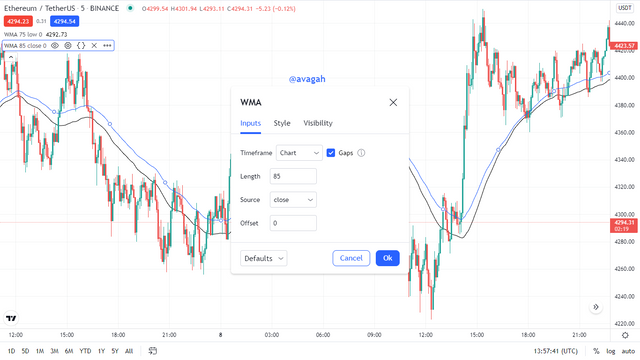
On the other hand, after adding the 2nd indicator on tradingview, we set the length to the 85-period setting and maintain the source to close. Just like the previous situation, we use any color for the indicator except red and green just to avoid any distraction from the chart.
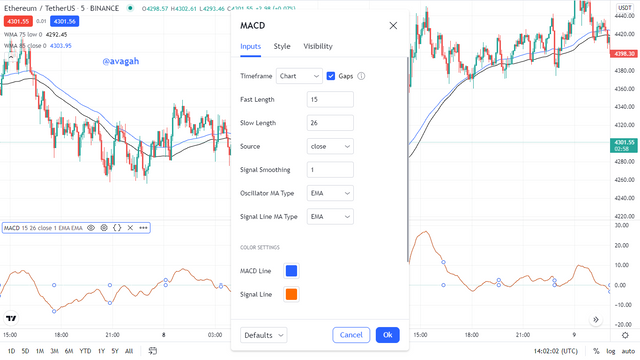
Finally, we alter our MACD indicator settings. It is very important to change the settings as required. Here, we change the fast length to 15 and maintain the slow length as 26. We also change the signal smoothing to 1.
Best Timeframe for the Strategy
As I said earlier, both scalpers and swing traders have their special criteria or standard for trading. Although the Puria method can be used by swing traders who use a longer timeframe, the method is best with scalping traders who use a shorter timeframe.
The reason for the shorter timeframe is that the strategy is very good in identifying more trading signals at a very shorter time. This implies that using a longer timeframe, the strategy would be irrelevant.
In any case, the strategy could be useful to both scalpers and swing traders. But preferably scalpers need the strategy more than the swing traders.
2. How to identify trends in the market using the puria method. Is it possible to identify trend reversal in the market by using this strategy? Give examples to support your article and explain them. (screenshot needed)
Identifying trends in crypto trading is the priority of a good trader. Trends help make easy entries and exit. Different traders use different technical strategies to identify trends to make trade entries.
I would demonstrate clearly how to identify trends and trend reversals with the Puria method.
How to identify Bullish Trend with the Puria method
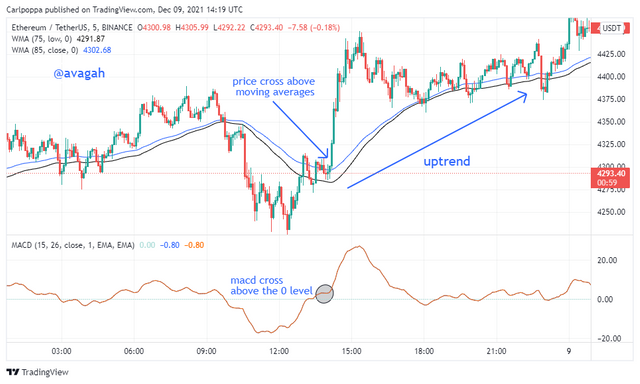
identifying bullish trends with this method is quite easy. First and foremost, we allow the MACD to cross the 0 levels and move in the bullish direction. Now, we allow the corresponding price of the asset at the time where the MACD crosses the 0 lines to move above the two moving averages. When all these conditions hold and a clear bullish candlestick appears above the moving averages, we say there’s a bullish trend.
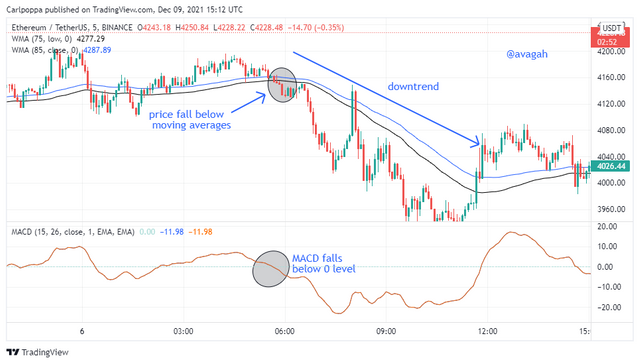
How to identify Bearish Trend with the Puria method
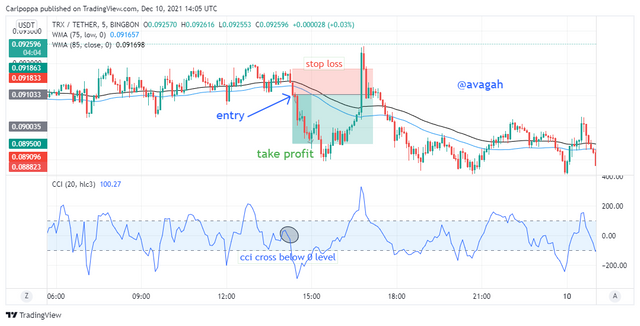
identifying bearish trends with this method is also very easy. we allow the MACD to cross below the 0 levels and move in a bearish direction. Now, we allow the corresponding price of the asset at the time where the MACD crosses the 0 lines to move below the two moving averages. When all these conditions hold and a clear bearish candlestick appears below the moving averages, we say there’s a bearish trend.
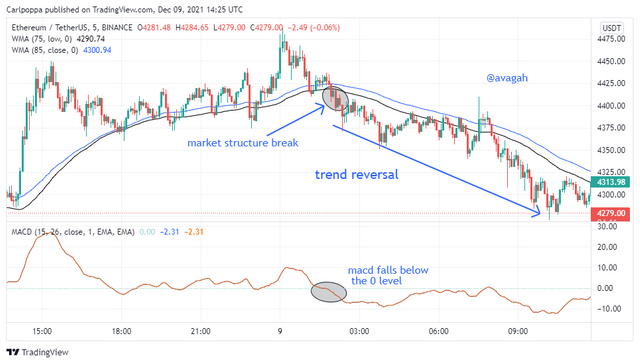
How to identify BullishTrend reversal with the Puria method
Identifying bullish trend reversal is quite technical with this strategy but it would be very simple if you understand. To identify bullish trend reversals, we consider the two moving averages as a support level in case of a bullish market structure or it serves as a bullish trendline in case of a bullish trend.
For a bullish trend reversal, the price crosses the support (the two moving averages) and move in the bearish direction. At the point where the price breaks the support or the trendline, the MACD crosses below the 0 level which indicates a clear reversal.
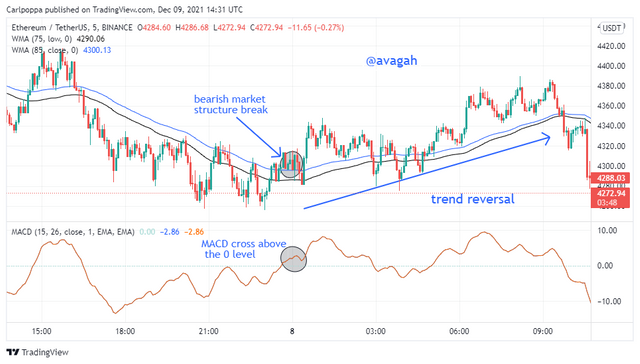
How to identify BearishTrend reversal with the Puria method
Identifying bearish trend reversal is also quite technical with this strategy but it would be very simple if you understand. To identify bearish trend reversals, we consider the two moving averages as a resistance level in case of a bearish market structure or it serves as a bearish trendline in case of a bearish trend.
For a bearish trend reversal, the price crosses the resistance (the two moving averages) and move in the bullish direction. At the point where the price break the resistance or the trendline, the MACD crosses above the 0 level which indicates a clear reversal.
3. In the puria strategy, we are using MACD as a signal filter, By confirming signals from it we enter the market. Can we use a signal filter other than MACD in the market for this strategy? Choose one filter(any Indicator having 0 levels) and Identify the trades in the market. (Screenshot needed).
There are numerous oscillating indicators that works exactly as the MACD. That’s means, other indicators can be used in place of the MACD indicator to filter signals just like the MACD in the Puria method.
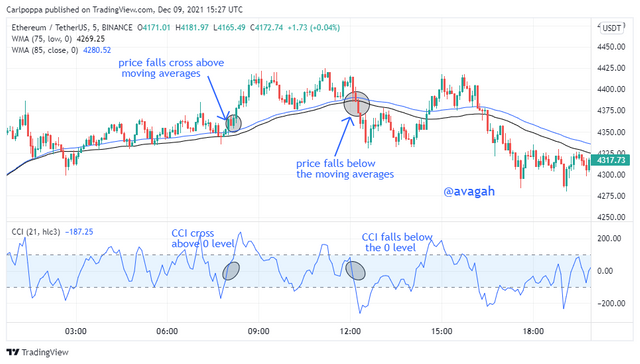
I would demonstrate how the CCI can be used as a filter in the Puria method. In my experience so far, the CCI even works better with the strategy than the MACD. Just like the MACD, the CCI crosses the zero level in case of any trend. Moreover, the CCI seems to even cross the 0 levels faster than the MACD.
Buy trade with the CCI as filter
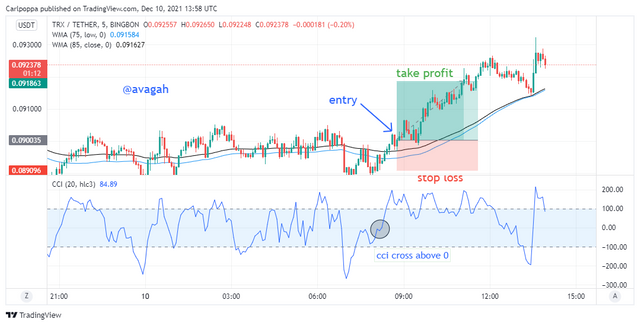
Sell trade with the CCI as filter
4. Set up 10 demo Trades (5 buying and 5 selling ) on 5 cryptocurrency pairs using puria method indicative strategy. Explain any 2 of them in detail. Prepare a final observation table having all your P/L records in these 5 trades.
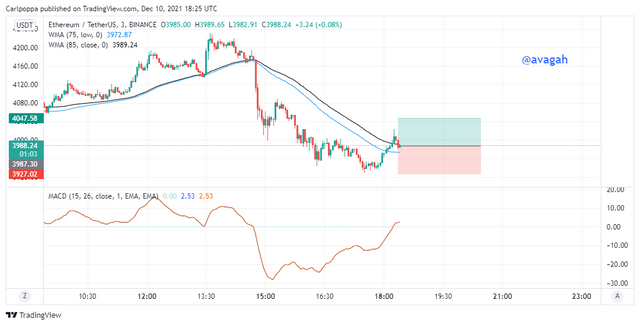
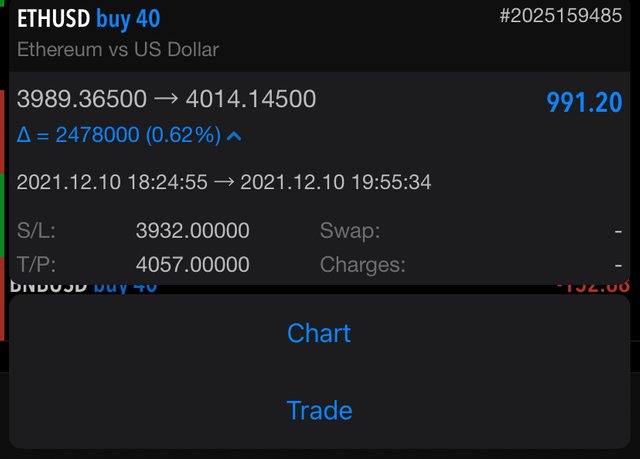
ETHUDT BUY
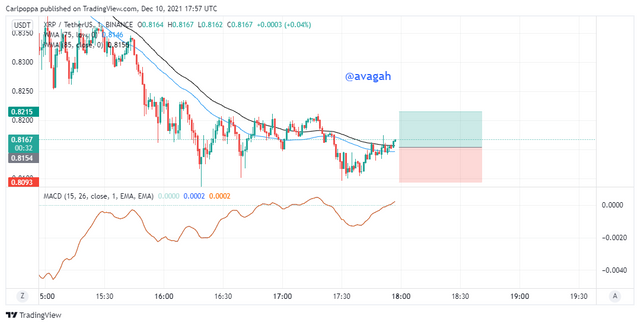
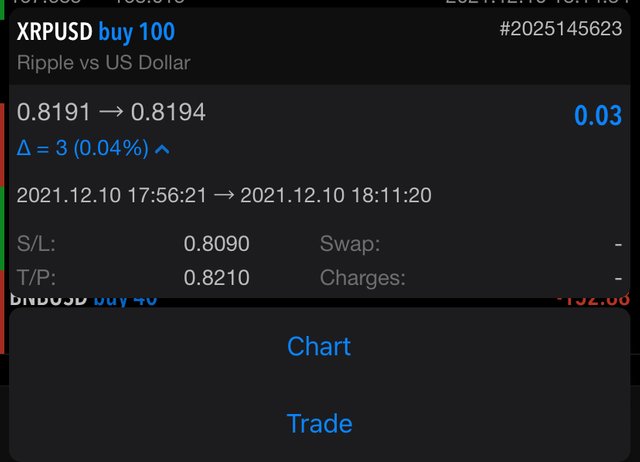
XRPUSDT BUY
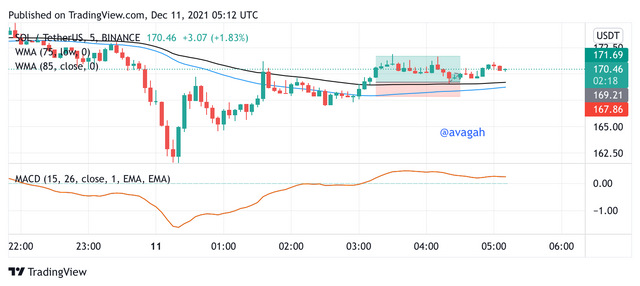
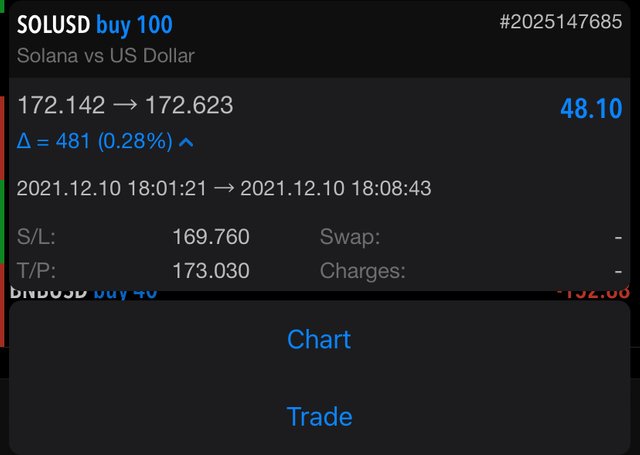
SOLUSDT BUY
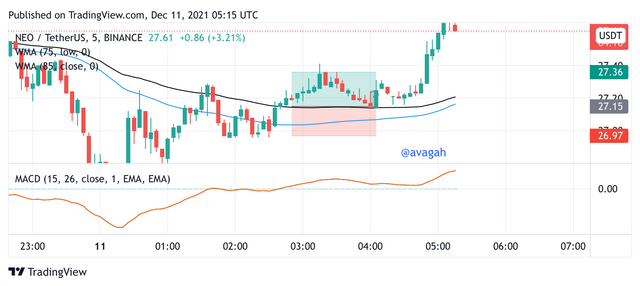
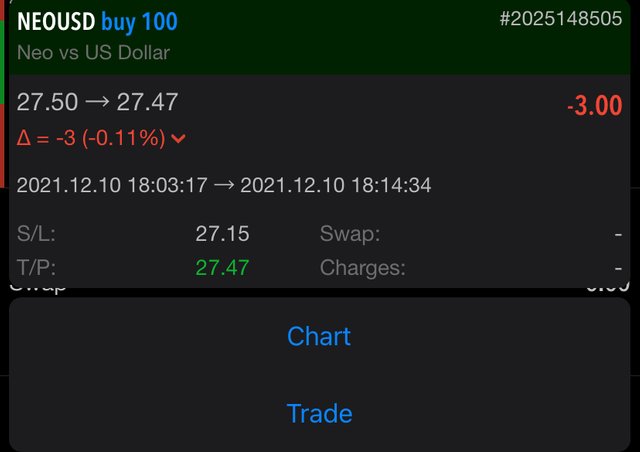
NEOUSDT BUY
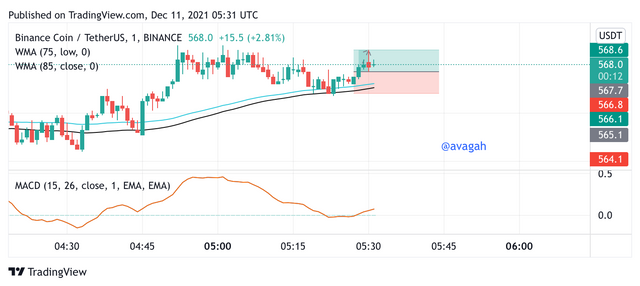
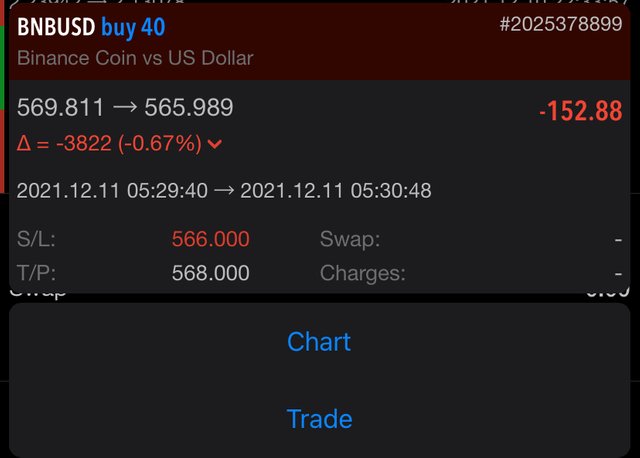
BNBUSDT BUY
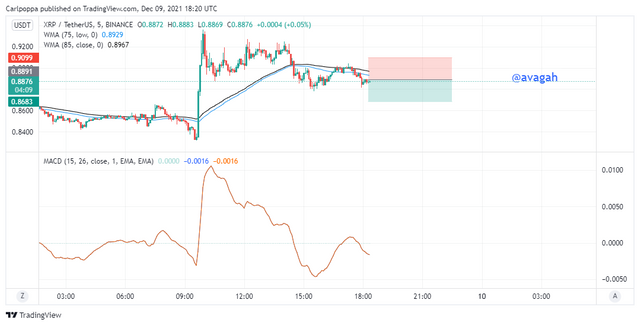
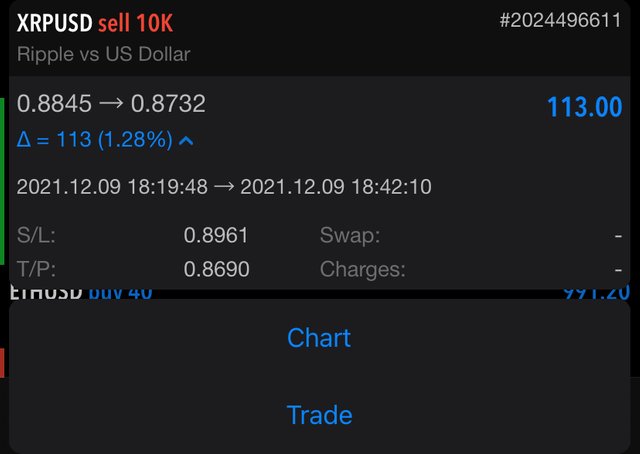
XRPUSDT SELL
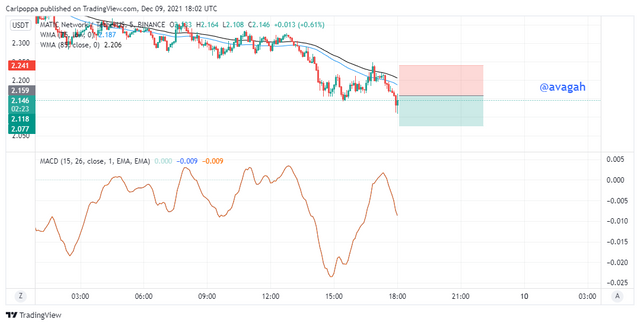
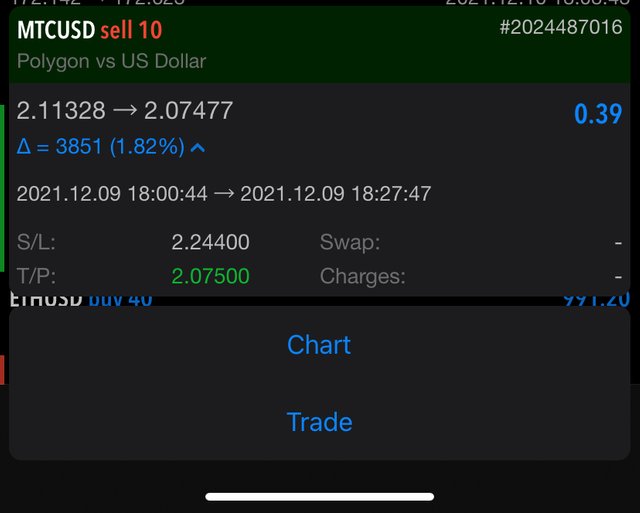
MaticUSDT SELL
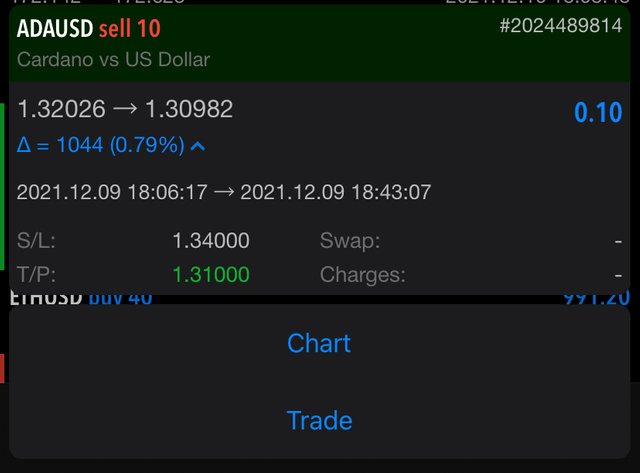
ADAUSDT SELL

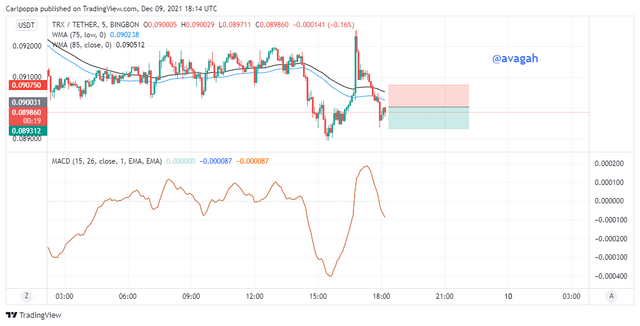
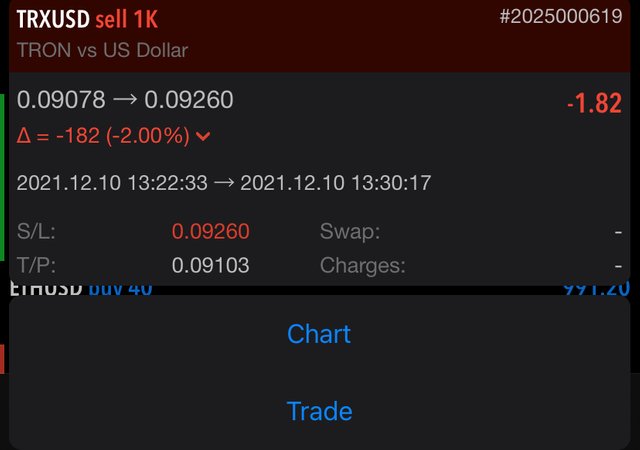
TRXUSDT SELL
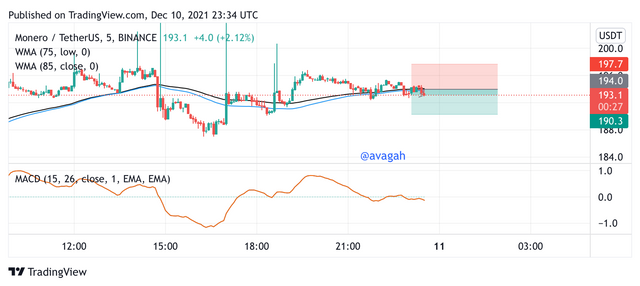
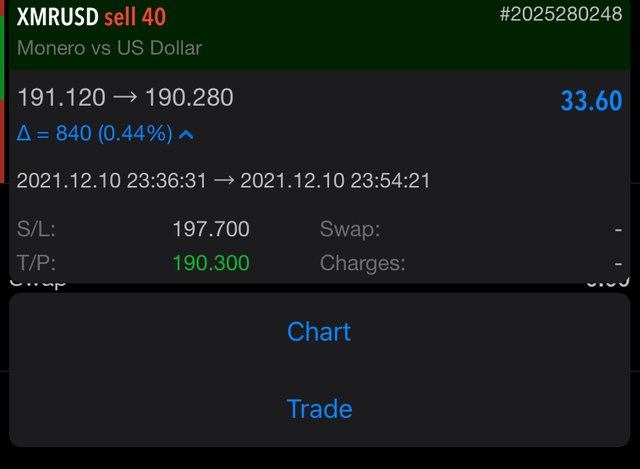
XMRUSDT SELL
| S.no. | Pair | Buying Price | selling Price | profit | loss | time frame |
|---|---|---|---|---|---|---|
| 1 | ETHUSDT | 3989 | — | 991.2 | —- | 3mins |
| 2 | XRPUSDT | 0.8191 | — | 0.03 | —- | 1min |
| 3 | SOLUSDT | 172.142 | — | 48.1 | —- | 5mins |
| 4 | NEOUSDT | 27.5 | — | —- | 3.00 | 5mins |
| 5 | BNBUSDT | 569.8 | — | —- | 152.88 | 1min |
| 6 | XRPUSDT | —- | 0.8845 | 113 | —- | 5mins |
| 7 | MTCUSDT | —- | 2.113 | 0.39 | —— | 5mins |
| 8 | ADAUSDT | —— | 1.32 | 0.1 | —— | 3mins |
| 9 | TRXUSDT | —— | 0.0907 | —- | 1.82 | 5mins |
| 10 | XRMUSDT | —- | 191.1 | 33.6 | —— | 5mins |
5. You have to make a strategy of your own, it could be pattern-based or indicator-based. Please note that the strategy you make must use the above information. Explain full strategy including a time frame, settings, entry-exit levels, risk management, and place two demo trades, one for buying and the other for selling.
Creating your strategy is a very technical skill that requires some technical ideas and experience in trading. However, I would create a strategy that can be used to trade crypto assets.
Poppa’s Strategy
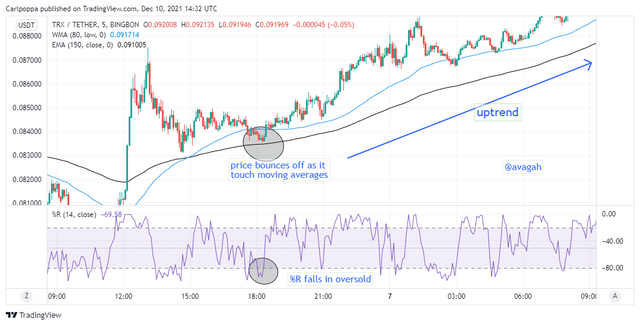
Poppa’s strategy is a technical strategy developed by @avagah. This strategy involves one technical strategy and 3 different technical indicators. These include trend lines, William %R, 150 EMA, and the 80 WMA.
Prepare your market ideology
The idea behind my strategy is to identify strong signals to make perfect trades. I reason for the trendline is to show clearly the current state of the market. That’s, you can’t make a sell order in a bullish market likewise, you can’t also buy in a bearish market.
The 150 EMA and 80 WMA would serve as support and resistance levels where the price bounces off. Finally, the William %R indicator Is used to filter the good signal with the overbought and oversold levels.
Combining all these strategies would be very reliable and close to impossible to fail.
This strategy is used purposely for crypto trading. However, the strategies could be used for other markets as well.
Taking about the timeframe, Although this is a newly developed strategy, I think the strategy would generate more signal and hence I recommend the use of a smaller timeframe. Between 3mins to 45 mins.
Predefined entry and exit
For the poppa’s strategy, this is how to make your entry
- Identify a trend (either bullish or bearish trend)
- Allow the price to hit either the 150 EMA or the 80 WMA and bounce back.
- after a clear touch on the moving averages, confirm the signal with the William %R indicator.
- In case the price was moving in a downtrend and reverses after the touch on the moving averages into an uptrend, The William %R should be in the oversold region before you enter the trade.
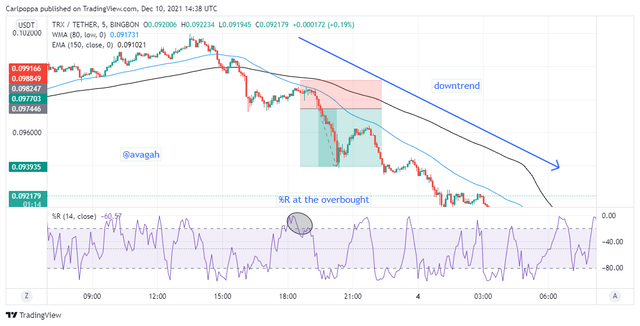
- On the other hand, If the price was moving in an uptrend and reverses in a downtrend after the touch on the moving averages, the William %R should be in the overbought to confirm the sell order.
Set a stop loss just below the moving averages and a corresponding take profit ratio.
Usually, for good risk management, the take profit should be higher than the stop loss.
It is also very advisable to monitor trades in case of a situation where you need to break even or close your position.
Buy trade with the poppa strategy
Sell trade with the poppa strategy
CONCLUSION
The Puria strategy is one of the best strategies I’ve ever come across. I think this strategy would be a very powerful tool for me. The strategy seems to identify signals very easily and is reliable as well.
From my experience with this lecture, I’ve realized this strategy works best with the 15 mins timeframe. This strategy could be a game-changer