Trading Strategy with Median Indicator - Steemit Crypto Academy |S6W4| - Homework Post for Professor @abdu.navi03

Understanding Median Indicator
In the affairs of trading, the concept of trend is very vital as it demonstrates the direction of the market price. However, a trader who understands the trend direction and the psychology behind its concept is likely to have a good trading result.
Thus, traders have different technical strategies and tools to capture trends such as indicators and so on. However, there are several indicators to picture trends and one of which is the Median indicator (MI).
The Median indicator is a trend-based, trend-catching indicator like the moving average, and so on for identifying trends in the market and the corresponding. The Median indicator is peculiar because it computes volatility in the market using the channel formed using an ATR(Average True Range) from the median line value.
The anatomy of the median indicator is a powerful tool that provides signals for traders. Thus, the ATR(Average True Range) of the median line is designed above and below the median line which is useful to define the price volatility. Perhaps the median lines are related to an EMA of the same length.
Although the slight difference between the median line and the EMA of the same length is the display of a cloud on the indicator which the trader uses to differentiate uptrend and downtrends within an observed period. Thus, this cloud is modified with two colours and it changes from purple to green.
This alteration of colours tells the trader when the market is on bullish or bearish trends. So, the green band appears when the median line passes above the EMA of the same length which signals a bullish signal. Similarly, the purple band appears when the median line whipsaw below the EMA of the same length which indicates a bearish signal.
Note: The green and purple colours are the default settings for colour which means it can be changed.
Parameters and Calculations of Median Indicator
Median Indicator Parameters
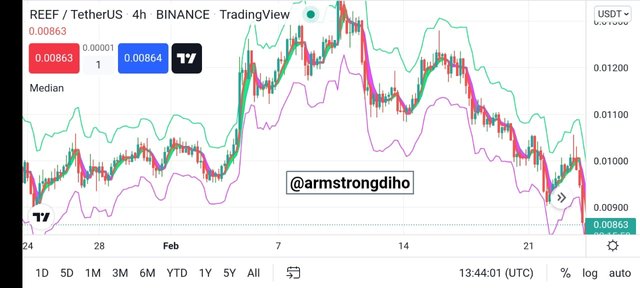
To determine the Median indicator parameters requires exploring any crypto chart platform and accessing the chart section. However, I will be using Tradingview platform for this example.
On the crypto chart above, we have the parameters of the median indicator. However, this stage was achieved by Clicking on the indicator menu on the upper toolbox of the platform. Then search for the Median indicator like inputting median and click on the search result to add the indicator to the price chart.
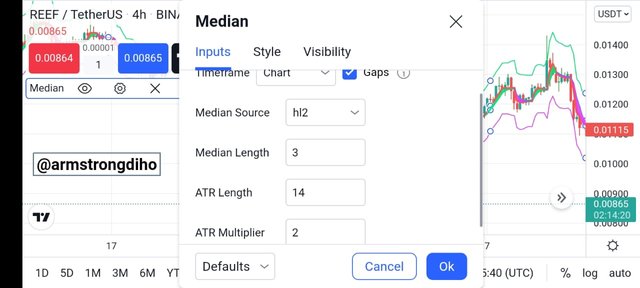
Then, on the indicator name and click on the Settings button to picture and configure the indicator parameters to your desired configuration.
Still, on the crypto chart above, we can see in the inputs section, the indicator median source, median length(period), ATR length, and ATR multiplier can be configured. Thus,
The median length(period) and the ATR value are very significant and sensitive parameters of this indicator that define the signal provided by the indicator.
Hence, incorrect inputs of these basic values can change the smoothing of the indicator and can lead to false signals.
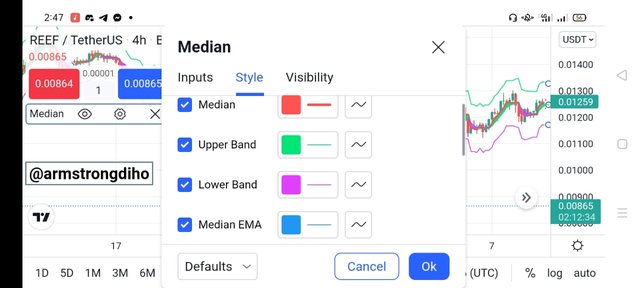
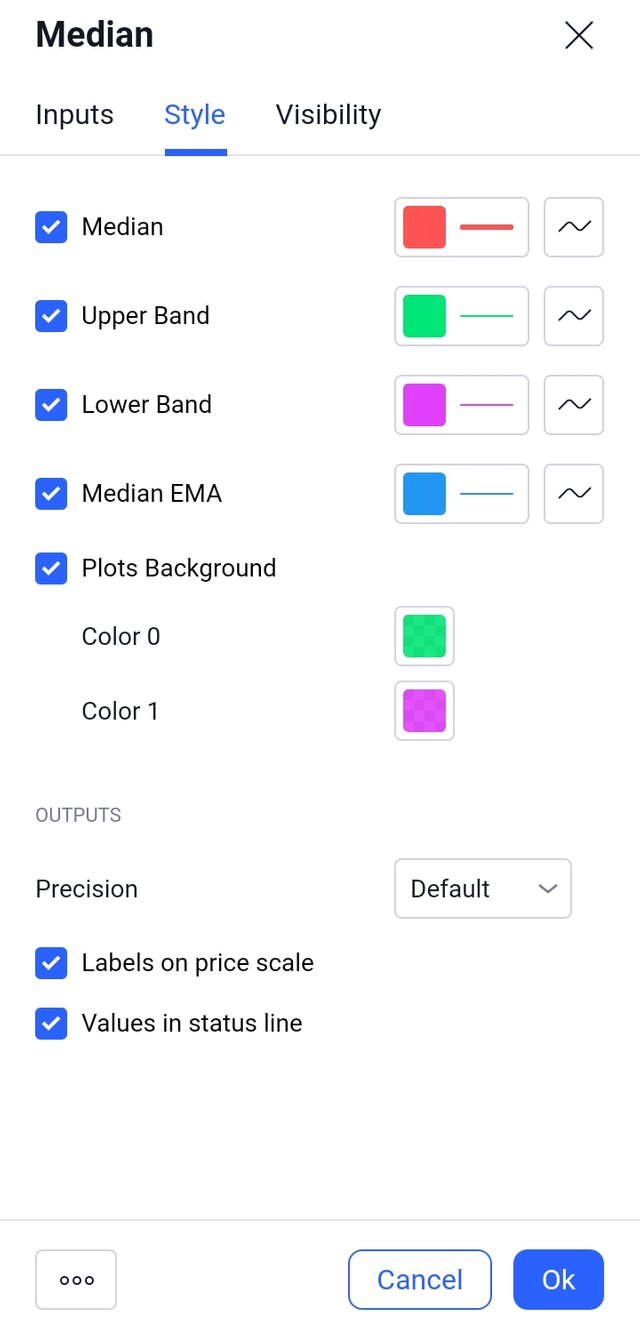
On the image above, the style section shows the indicator line appearance and can be modified and configured to suit the desired style of the trader. Hence, this section is not significant in the efficiency and effectiveness of the indicator.
Median Indicator Calculation
Generally, indicators are obtained from mathematical representations of price data points such as OHLC over an observed period. However, the Median indicator calculation is established on the proportion difference between the median value and the EMA value over the period.
That's the ATR and a multiplier value to design the upper and lower parallel band above and below the median line.
Median indicator = median value, EMA value (ATR %change)
When EMA %change, the Median value, plot Purple while when Median %change, the EMA value, plot Green.
The Median indicator formula is :
Median = highest price + lowest price / 2
EMA = Closing price x multiplier + EMA (prior day) x (1-multiplier)
Median length = period of observation with a value of 3 by default.
ATR Multiplier = In the formation of the upper and lower band, the value ATR is multiplied by the ATR with a value of 2 by default.
Upper band = Median length + (2ATR)
Lower band = Median length - (2ATR)
Through all these values the indicator obtains its calculation. However, when the EMA value is higher than the median value, a purple cloud colour is formed which tells bearish signal transition, as such, a sell position can be made. Also, when the median value is higher than the EMA value, a green cloud colour is formed which entails a bullish trend transition, as such, a buy position can be made.
Moreover, these values presented above are by default of the indicator and any user can modify it based on your convenience method.
Uptrend from Median Indicator
The median indicator can be used to signal uptrend as it is a trend-based indicator possessing the characteristics of the moving average. However, the colouration of the clouds formed from the difference between the median and EMA values respectively define uptrend.
Basically, an uptrend is observed when the median indicator cloud change to a green colour which entails the median value is above the EMA value. Let's check out the crypto chart below.
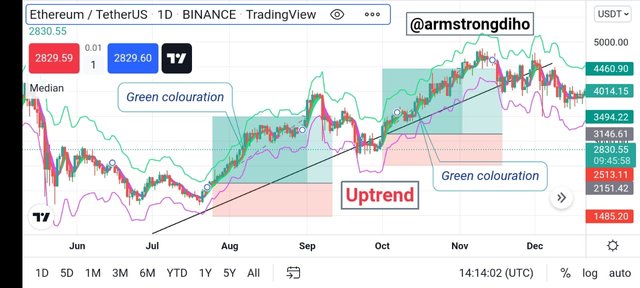
From the chart above, the indicator cloud changed to green colouration which signifies a bullish trend. Here a bullish position can be performed, as such, traders can place a buy position.
Downtrend from Median Indicator
The median indicator can be used to signal a downtrend as it is a trend-based indicator acquiring the traits of the moving average. However, the colouration of the clouds formed from the difference between the median and EMA values respectively determine downtrend.
Basically, a downtrend is observed when the median indicator cloud change to a purple colouration which entails the EMA value is above the median value. Let's check out the crypto chart below.
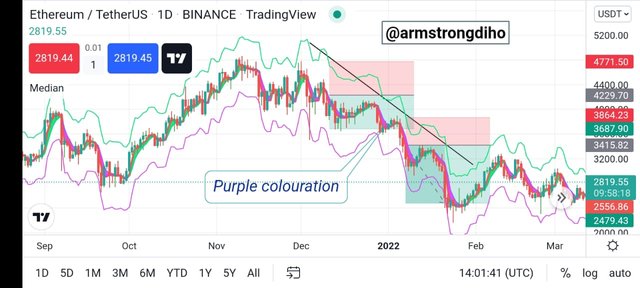
From the chart above, the indicator cloud changed to purple colouration which indicates a bearish trend. Here a bearish position can be performed, as such, traders can place a sell position.
Identifying Fake signals with Median Indicator
Generally, No indicators are 100% accurate and efficient. And can produce fake signals as they lag behind the price and obtain their signal from historical price data points. Thus, the Median indicator is included which means it can generate fake signals.
Perhaps, identifying trend using the median indicator all banks on the users' mastery of the indicator. But it works best with other indicators to identify excellent trading signals and filter out false signals. To illustrate this, I will integrate the median indicator with the RSI indicator.
In the nutshell, the RSI indicator is a volatility-based technical indicator that aims to identify the current market condition in periods of overbought and oversold conditions. We observe an overbought condition when RSI is above 70, as such, signals a bearish trend reversal whereas oversold when RSI is below 30, as such, signals a bullish trend reversal.
Let's check out the chart below for better clarification.
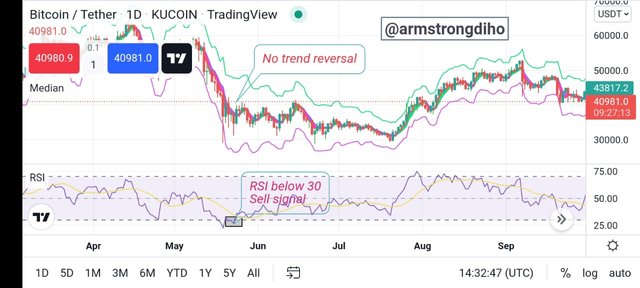
From the chart above, the RSI is below 30 which is in oversold condition and signals a potential bullish reversal. On the other hand, the median indicator cloud colouration was still purple and yet no sign of bullish reversal. As such, the price continued its downtrend as a result of a strong presence of sellers in the market.
The illustration above shows a mismatch signal between the median indicator and the RSI indicator. So, as a trader, we need to wait for both indicators to give a bullish signal before making any trade decision that's only when you want to avoid false signals.
That's a good trade signal that leads to effective trading and to filter false signals using the median and RSI indicator, the two indicators should be in agreement on a viewpoint of the market.
Opening a Demo Trade using the Median Indicator
Here, I will be opening a demo trade position from the signal on the Median indicator. However, the analysis and the trade will be carried out on Tradingview and Tradingview paper trading respectively.
Buy Position- LUNA/USDT
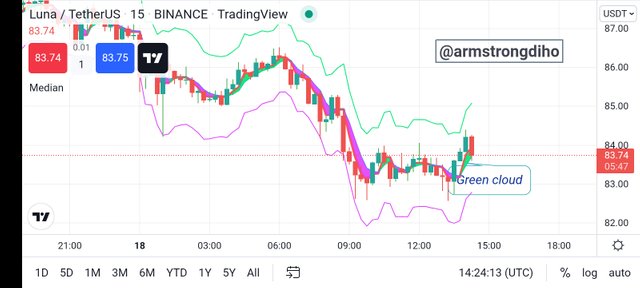
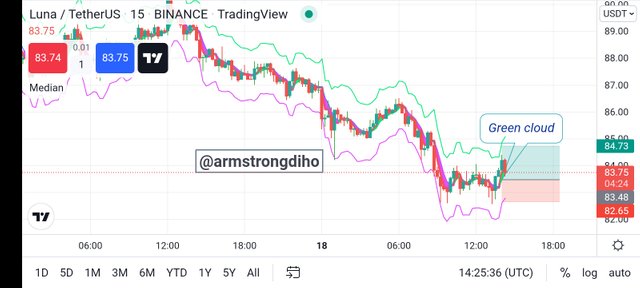
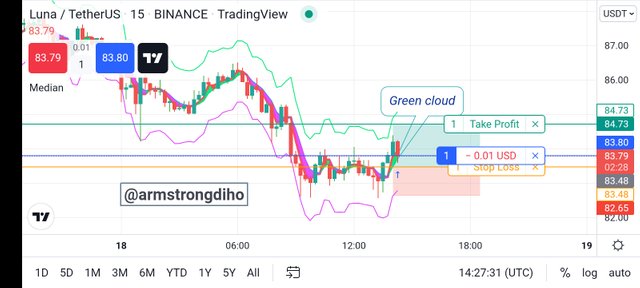
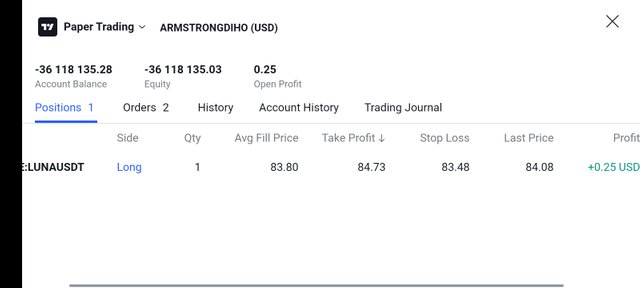
Glancing at the crypto chart of LUNA/USDT above, I observed the market price was previously in a downtrend as demonstrated on the median indicator with a purple cloud. But something happened after a while, the cloud shifted from purple to green with a formation of a bullish candle. As such, it signals a possible trend reversal signal and a chance to place a buy position. I carried out a buy position on LUNA/USDT with entry $83.48, stop-loss- $82.65 and take profit- $84.73 as shown on the chart below.
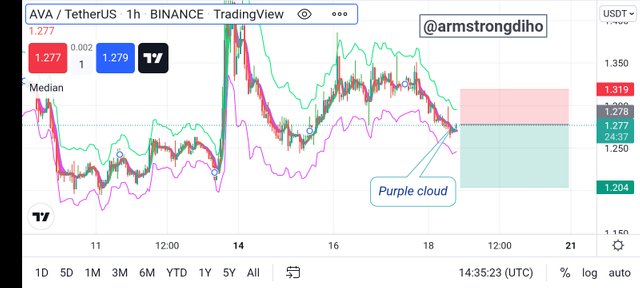
Sell Position- AVA/USDT
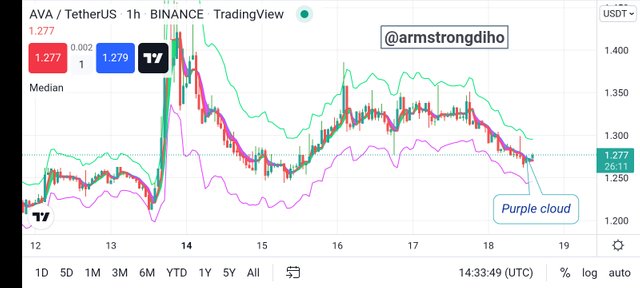
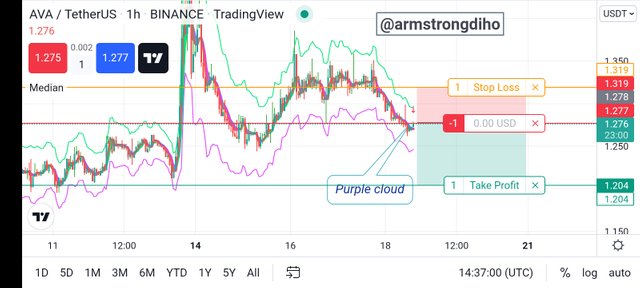
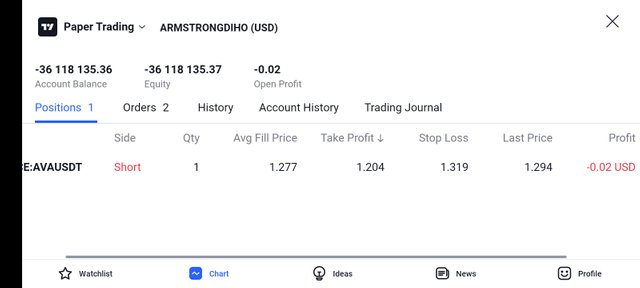
Staring at the crypto chart of AVA/USDT above, I observed the market price is in a downtrend as demonstrated on the median indicator with a purple cloud. As such, it signals a downtrend and a chance to open a sell position. I carried out a sell position on AVA/USDT with entry of $1.278, stop-loss- $1.319 and take profit- $1.204 as shown on the chart below.
CONCLUSION
From the overview of what we have discussed above, the median indicator is an important indicator to identify trends as it's a trend based indicator. However, we obtain signals from the median indicator based on the formation of the cloud colouration.
Thus, a bullish trend signal is observed when the median cloud changes from purple to green while a bearish trend signal is obtained when the median cloud changes from green to purple.
Furthermore, no indicators are always 100% accurate and efficient when used alone. For a good signal, we need to use other technical indicators or tools to filter out false signals just as we did when combining median and RSI indicators.
So, to enjoy the median indicator, we have to understand and interpret how it works. Ideally, always configure the parameter of the indicator to suit your trading style. And, support it with other technical indicators and tools.
THANKS FOR READING THROUGH
Cc: @abdu.navi03
