Crypto Academy / Season 3 / Week 4 – homework Post for [professor @reminiscence01] Candlestick Patterns
Am gladdened once again for yet another opportunity of this wonderful edition by the cryptoacademy. From the lecture offered by Professor @reminiscence01, reading through this lecture series have given me a better insight on how to read and identify different candlestick patterns on charts and also give accurate information on market behaviour . To this, I will be writing based on the task given by the Professor.
In your own words, explain the psychology behind the formation of the following candlestick patterns
Bullish engulfing Candlestick pattern
The psychology behind the formation of bullish engulfing candlestick pattern is based on the anatomy of the engulfing candlestick pattern. If the candlestick is moving in a downward trend, and the bullish engulfing candle is identified along the trend signified by a higher length of the bullish candle engulfing the previous red bearish candle, this indicates more influx of buyers of that asset than the sellers and as such will likely cause an uptrend move of the asset. So therefore engulfing candlestick pattern is caused when an asset is overbought i.e more buyers than sellers.
Doji Candlestick pattern
The psychology behind the formation of Doji candlestick pattern is based on the anatomy of its candlestick pattern. This type of candlestick is formed when there is a tie between the influx of buyers and sellers and as such none of them are in control of the price of the asset. This is a critical time where traders avoid so not fall a victim of the outcome.
The Hammer Candlestick pattern
The psychology behind the formation of Hammer candlestick pattern is based on the anatomy of its candlestick. This type of candlestick which is signified by a long wick and a small body is formed when there is a strong rejection of price by the buyers at the opening, thus at the end tail of the closing buyers thereafter dominated and took whole of the price causing a reversal in the trend movement.
The morning and evening Star Candlestick pattern
The psychology behind the formation of the morning star and evening star candlesticks are also based on the anatomy of their candlestick. The morning star candlestick is formed as a result of more sellers dominating the market and at some point the buyers took whole of the market thus causing a reverse in the trend direction leading to an uptrend in the asset. This type of candlestick most times happens in the support level.
The evening star candlestick is a reverse case of the morning star, here there are more buyers influencing the price of the asset to move in an uptrend direction, but at some point the sellers overtook the price of the asset thereby leading to a reverse in the direction of the trend i.e from uptrend to downtrend. This type of candlestick most times happens in the resistance level.
Identify these candlestick patterns listed in question one on any cryptocurrency pair chart and explain how price reacted after the formation. (Screenshot your own chart for this exercise)
Bullish engulfing pattern – ADA/BUSD chart
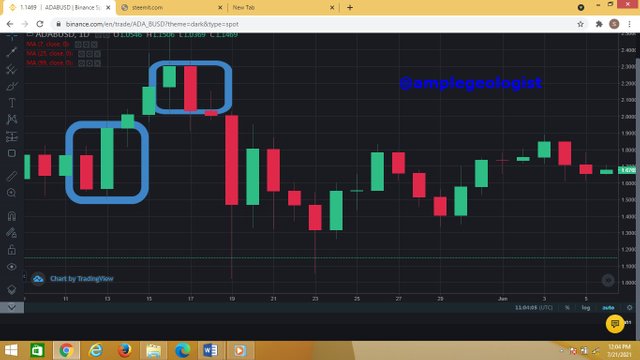
Looking at the above chart, after the formation of the bullish engulfing candlestick pattern, there was a tremendous uptrend in the price of the asset caused by more buyers taking control of the price of the asset. If you look at the chart, there is also a bearish engulfing candlestick caused by sellers taking whole of the market thus causing a drift in price of the asset to a downtrend.
Doji candlestick pattern – ADA/BUSD chart
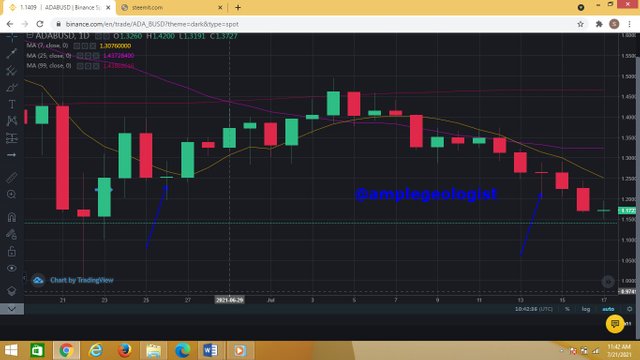
The above chart shows Doji candlestick, after the formation of the candlestick, the price closed at the opening price, meaning neither of the buyers nor sellers could push the price of the asset.
Hammer candlestick pattern – ADA/BUSD chart
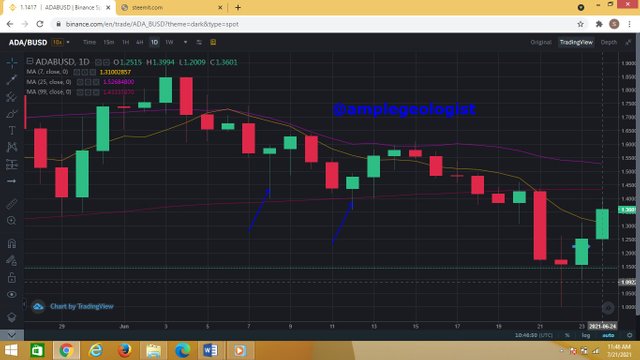
The formation of the hammer candlestick on the chart above, the price of the asset experienced a reversal in its direction trending in the uptrend caused by buyers of the asset.
Morning star candlestick pattern – ADA/BUSD chart
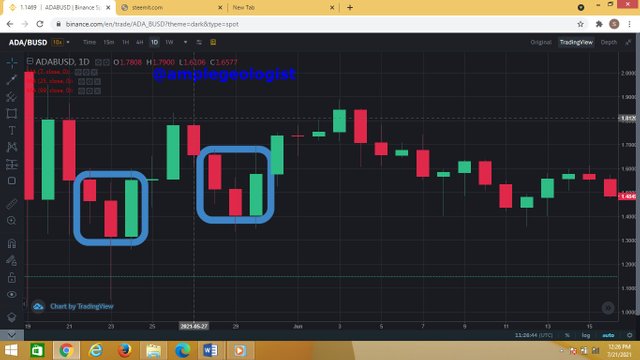
According to the chart above, the price of the asset after the morning star candlestick formation experienced a bullish trend. The price rose as more buyers continued buying and owning the assets.
The evening star candlestick pattern – ADA/BUSD chart
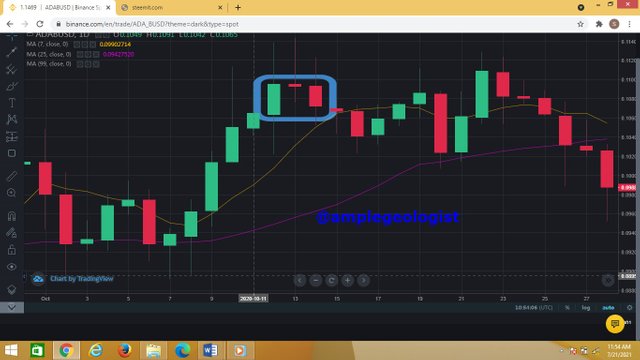
After the formation of the evening star candlestick, the price of the asset also experienced a drift towards downtrend meaning they were much sellers dominating the market causing a fall in the price of the asset as shown in the chart above.
Using a demo account, open a trade using any of the candlestick pattern on any cryptocurrency pair. You can use a lower timeframe for this exercise. (Screenshot your own chart for this exercise)
For this task, I will be using the meta Trader 4 demo account. I used a bullish engulfing candlestick pattern as shown below
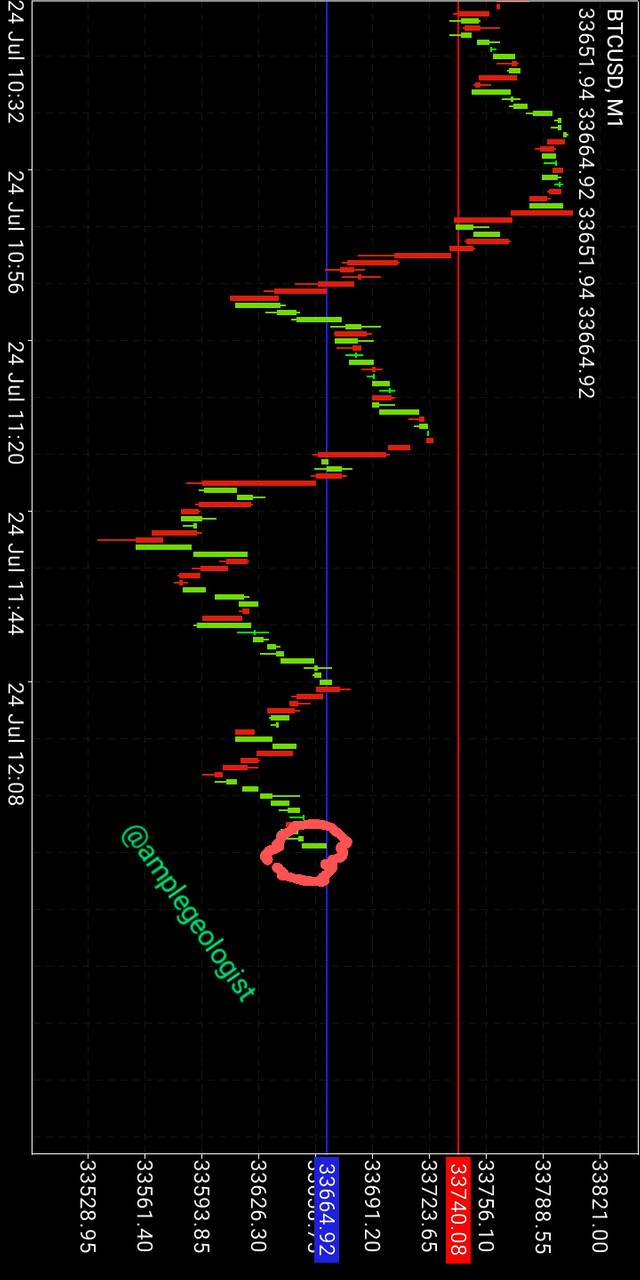
In the above chart, I opened a trade in the position, because the signal shows a bullish candlestick pattern, and so there is likely to be a bullish trend movement. I opened the trade with a one minute time frame
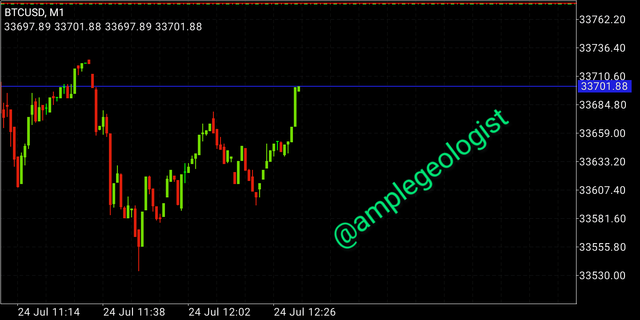
As you can see in the above chart, the resultant effect of the trade shows a bullish reversal trend.

After making profit from my trade, I closed the trade as shown in the above screenshot.
Conclusion
Candlestick patterns are very important when it comes to understanding price movement of assets in charts. This is one of the major tools used by traders so as to be able to follow up the trend and movement of assets on chart. A deeper understanding and interpretation of the candlestick pattern will help an investor or trader to know when to open a trade and also close a trade without incurring loss and liquidity and also being able to predict and forecast the future trend of an asset in price.
Thanks Prof. @reminiscence01 for this great and wonderful lecture. It was mind blowing.
.jpeg)
Hello @amplegeologist , I’m glad you participated in the 4th Week of the Beginner’s class at the Steemit Crypto Academy. Your grades in this task are as follows:
Observations:
This is not a bullish engulfing candlestick chart. The bullish engulfing candlestick chart is made up of two candlesticks. A bearish candle and a bullish candle engulfing the bearish candle.
Recommendation / Feedback:
Thank you for submitting your homework task.
Thank you Prof. Observations noted