Trading with Accumulation / Distribution (A/D) Indicator - Crypto Academy / S4W5 - Homework Post for @allbert.
This is my submission for the Assignment provided by Professor @kouba01. The session was about JustSwap which is a DEX developed on Tron Blockchain.
1- Explain in your own words what the A/D Indicator is and how and why it relates to volume.
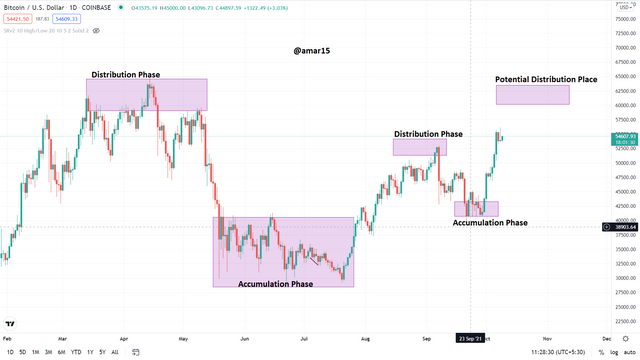
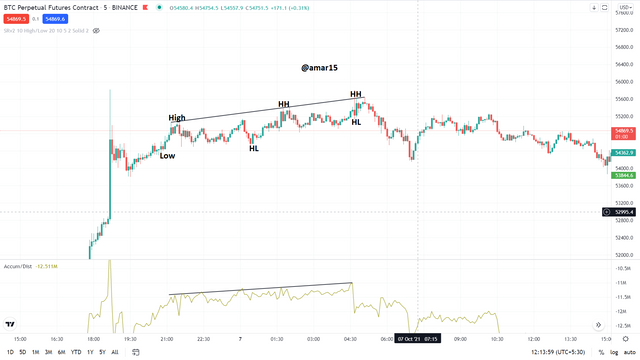
A/D indicator stands for Accumulation & Distribution Indicator, as Professor @albert explained in the call that the Price of Asset moves in two phases Accumulation where the Holders/Investors are buying any particular asset to hold for sometimes and Distribution is the place where the Investor/Holder book their profit or empty their bags. You can see the simple example in this chart-
.png)
how and why it relates to volume.
I will be discussing the detailed formula and calculation for the A/D indicator, As the professor explained in the class the A/D indicator is made of Price Action and Volume so it will definitely have a relation to Volume. Here is the formula to calculate the value of A/D. As the A/D is made up of Price Action and Volume so we need to an important component in the formula-
Money Flow Multiplier = [(Close- Low)-(High- Close)]/(High-Low)
Money Flow Volume = Money Flow Multiplier * Volume of Current Period
We can clearly see this formula uses Volume and it is directly proportional to the A/D value so if the Volume will increase in any particular direction then the value of A/D will also increase.

2- Through some platforms, show the process of how to place the A/D Indicator
We can implement A/D indicator using the below simple steps-
Step-1: Go to https://www.tradingview.com/chart/sLvhYWt7/ and open chart of any asset.
.png)
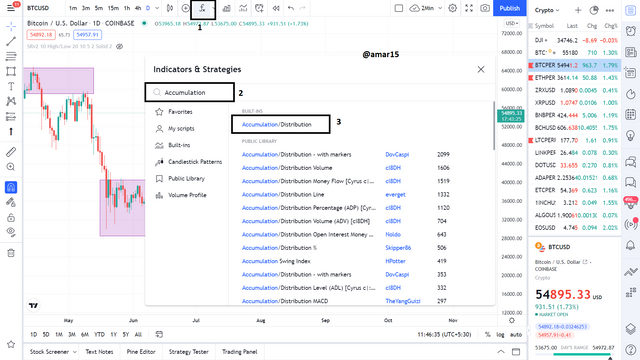
Step-2: Click on the Indicator Section
Step-3: Type "Accumulation" in Search Box and click on the Indicator to implement on the chart.
.png)
Step-4: You can see now, it is implemented on the chart, you can also play with the settings as per your need.
3- Explain through an example the formula of the A/D Indicator. (Originality will be taken into account).
A/D is made up of Price Action and Volume so we need an important component in the formula-
Money Flow Multiplier = [(Close- Low)-(High- Close)]/(High-Low)
Money Flow Volume = Money Flow Multiplier * Volume of Current Period
Let's assume there is a candle,
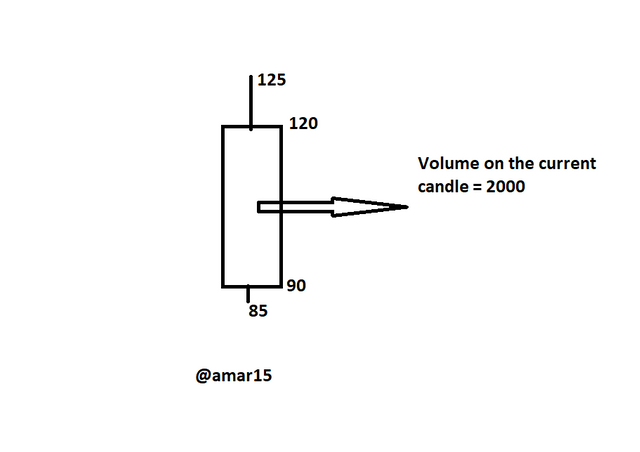
Closing Price= 120
Open Price= 90
Low Price= 85
High Price= 125
Also, let's assume the previous AD value of the candle was 3000.00, and let's find out other values-
Money Flow Multiplier = [(Close- Low)-(High- Close)]/(High-Low)]
Money Flow Multiplier= [(120-85)-(125-120)]/(125-85)]= 30/40= 0.75
Money Flow Volume = Money Flow Multiplier * Volume of Current Period
Money Flow Volume = 0.75 * 2000 = 1,500
ADI = Previous ADI + Current Period's Money Flow Volume
ADI= 3000+ 1500= 4500
The above calculation shows the strength of the trend is increasing.
4- How is it possible to detect and confirm a trend through the A/D indicator?
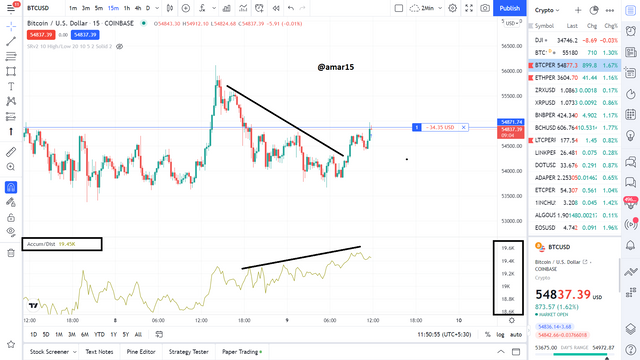
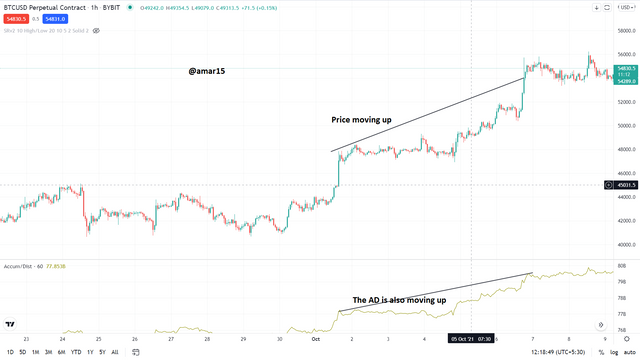
As we know AD indicator is calculated by the Price Action and Volume, So If the value of AD is increasing in the direction of the trend then it is considered as Strong Trend and we can also use it for the trend confirmation. iF the Price is moving up and along with that AD is also increasing up then it is considered as a confirmed trend as you can see in the below chart.
.png)
Here is another Chart of BTC on 1 hr timeframe you can see it is in a strong uptrend and AD is confirming the trend.
.png)
5- Through a DEMO account, perform one trading operation (BUY or SELL) using the A/D Indicator only.
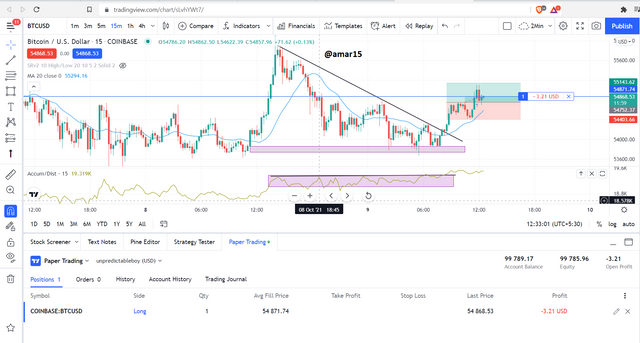
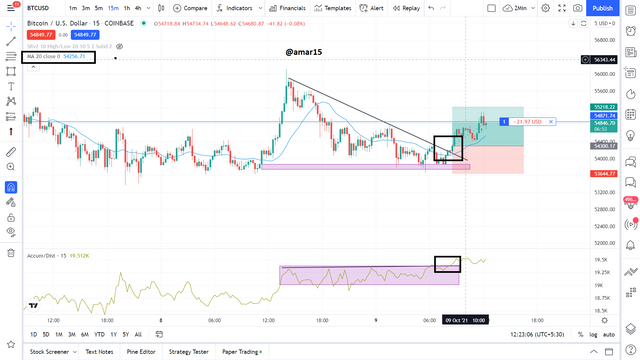
I have taken 1 breakout trade of BTC in 15 min timeframe, Well, I should have entered at the time of the breakout in the AD, Price & Closing above 20 SMA however due to some reason I missed the opportunity and have now taken entry on the Retest which is considered as Safe Entry.
.png)
I took the entry earlier and got the Target too however failed to capture the Screenshot. I still believe this will go up and now waiting to cross my target so that I can take a new Picture of the running profit.
Entry Price: $54871
Stoploss: $54450
Target: $55150
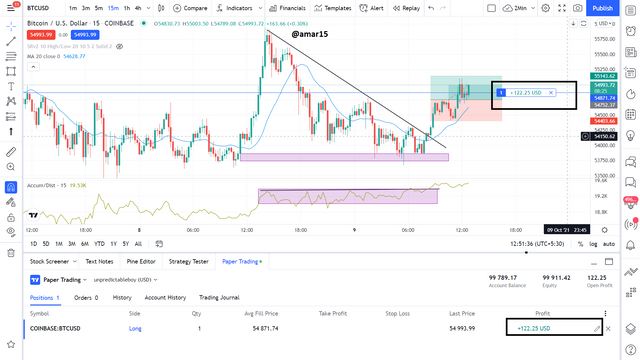
Slowly it started moving in my direction again... let's see if I get the target or not.
.png)
Soon, I am going to upload the result of my profit.. still waiting to go up and chase the target again.
6- What other indicator can be used in conjunction with the A/D Indicator. Justify, explain and test.
We can use AD with other indicators as well to get more confirmation like MACD, Moving Averages (MA/EMA), Bollinger Bandetc. I will be using 20 SMA to confirm the Breakout in the Price & AD. To implement Moving Average on the chart you need to Type "Moving average" in the Indicator Search box and then needs to click on the Indicator Setting option to set up the period.
.png)
Observation:
In the above chart, you can see the Breakout in the Price and AD as well. Here we are getting 3 confirmations-
- Breakout in Price
- Breakout in AD
- 15 min Candle Closing Above 20 SMA.
More confirmation always ensures us that we are taking a good trade and makes us confident to hold the trade if for some time it doesn't go in our direction.

Conclusion
Most of the Indicators are made of Price & Volume and AD is one of them. It is a good indicator and if we will combine it with other confirmation then it can simply make our trading more profitable & Accurate. I enjoyed doing this assignment and will be waiting for the next course from the Professor.