Assignment Steemit Crypto Academy Season 3 Week 5:-Trading Crypto With Ichimoku-kinko-hyo Indicator - Part 2[@kouba01]
Hi everyone, I hope you are doing well. The lesson was really interesting initially I thought this would be very difficult to understand because of its name but the professor made it very simple. This is my submission for the assignemnt provided by the professor.
1. Discuss your understanding of Kumo, as well as its two lines.
This is a pretty new indicator for me and I have never heard about it. As per my understanding Kumo is a versatile indicator that defines the dynamic supports and resistance on the chart and allows us to avoid false breakout trades. Apart from it also defines the Momentum, Trends, and reversals. We can use this indicator in any time frame and any asset where the price exists like I can use this indicator in Stocks, Forex, Crypto, Commodities.
.png)
.png)
Here is the default settings-
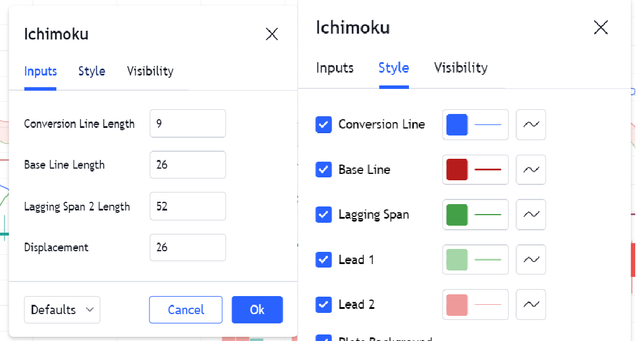
Here are the components of Kumo-
- Conversion Line
- Base Line
- Lagging Span
- Leading Span A (SSA)
- Leading Span B (SSB)
1. Conversion Line- It shows the short-term price momentum and also works as minor Support & Resistance. As you can see in the picture. It shows the midpoint over the last 9 periods.
2. Base Line- It serves signals on the support and resistance levels. It is the midpoint of the high and low prices over the last 26 periods. It can be used to analyze the price momentum if the price is above the baseline that means it is in uptrend and if it is down the line then it is downtrend.
2. What is the relationship between this cloud and the price movement? And how do you determine resistance and support levels using Kumo?
The Cloud provides the support and resistance levels to the price that helps traders to take action. The thicker the cloud is the strong support and resistance it will be.
It is considered as the uptrend when the Leading Span A (SSA) Green cloud is rising and above the SSB (Red cloud line).
It shows a downtrend when the Leading Span A(SSA) is falling and below the Leading Span B also making a red cloud. you can see the same thing in the below picture.
.png)
.png)
3. How and why is the twist formed? And once we've "seen" the twist, how do we use it in our trading?
As we already know we have three types of trends- Uptrend, Downtrend, and Sideways which is a kind of messy thing when the price is kept accumulating in the range. We often see Twist in the range-bound market when the Span A and Span B decreases the length of the could and the lines (Base Line, Conversion Line, and lagging line) mix sometimes. Being an option seller in the Stocks I used to trade the Range bound market as well so what I used to do is to sell the CE on the high end and even if it gets sideways I get chances to collect premiums of the Option buyers.
Here in the picture you can see how it is predicting the trend reversal and giving us hit from here the price may reverse.
Example of Uptrend and Downtrend Twist-
.png)
Here is the example of Neutral Twist- You can see in this picture there is no clear indication and the market is completely sideways.
.png)
4. What is the Ichimoku trend confirmation strategy with the cloud (Kumo)? And what are the signals that detect a trend reversal?
In the Ichimoku indicator, if the SSA is above SSB then it is considered as Uptrend and this situation starts making green could. If SSA is below SSB then it is considered a Downtrend and this situation starts making red cloud. Once we confirm the trend using SSA and SSB we can look for opportunities for either buy or sell as per the trend.
If the Conversion line crosses above the Baseline then it generates Buy Signals and if it crosses below the baseline then it generates a sell signal as you can see in the below picture. The dark brown line is the Conversion line and the blue one is baseline. These two lines are not enough for the high probability trades and in the next question I will use Cloud to make the trade a high probability trade.
.png)
.png)
5. Explain the trading strategy using the cloud and the chikou span together.
To get the high probability trade I will be using Cloud and Span along with the Crossover strategy. The Crossover strategy will be the same as mentioned above but we will mix cloud and span here to get strong confirmation. I am strongly in the favour of drawing your own important levels that increase the accuracy of the signals.
Buy Setup: -
a) The conversion line crosses above the Baseline
b) The price should be above the Green Cloud to get a strong signal.
.png)
Sell Setup: -
a) The conversion line crosses below the Baseline
b) The price should be below the Red Cloud to get a strong signal.
.png)
6. Explain the use of the Ichimoku indicator for the scalping trading strategy. (Screenshot required)
Ichimoku is a good tool for scalpers to take quick entries and exits basis the signals provided by Indicator. In scalping, we will use a lower time frame and try to get at least 1:1 Risk and reward ratio. Being a scalper we need to be very quick to book the Loss & profit also keep the emotion aside. I am going to use 3 min timeframe to get the Scalp signals using the Ichimoku indicator.
Even for the scalping, we will follow the same setup discussed above on the lower time frame. Here are the example of few Scalp trades opportunities.
.png)
.png)
.png)

Conclusion
I am thankful to professor @kouba01 for bringing this amazing lesson and introducing us to a new indicator that will help us to get better trade. I enjoyed completing the assignment and learned a lot of new things from the lesson also going to implement the strategy in live trades after some Paper trading. The indicator only useful for the long term positions but we can also do scalping using lower time frame.
Hello @amar15,
Thank you for participating in the 5th Week Crypto Course in its third season and for your efforts to complete the suggested tasks, you deserve a 2/10 rating, according to the following scale:
My review :
Unfortunately, the article included weak content, and this is due to a lack of understanding of the questions asked. Most of your answers focus on the Ichimoku indicator that we explained in the first part, and in this second part, we focused on the Kumo cloud, and here are some notes:
The kumo is not an indicator, but a part made up of two of the five components of the Ichimoku indicator, the Senkou Span A and the Senkou Span B respectively, so your interpretation of the cloud and its lines was wrong, due to the confusion between them and the Ichimoku indicator.
In the second question also there is a lack of understanding of what is required and a confusion between its two parts. The relationship between price action momentum and the cloud determines how thick it is as well as identifying support and resistance levels which differs from the traditional method as being more dynamic.
Explaining Twist and how to use it in trading was not precise in its analysis.
As for the fourth and fifth questions, you did not understand what was required, so your answers were not correct.
Thanks again for your effort, and we look forward to reading your next work.
Sincerely,@kouba01
Thank you for your review professor. I will take care of these points.