Crypto Academy week 6 season two - Homework Post For [@kouba01]- Trading with MACD indicator.
Hello everyone hope you all are fine and safe. Today i attend lecture by @kouba01 professor in which i learn some topics regarding MACD indicator. Now i am going to submit my homework task for this lecture.
Cryptocurrency trading has becoming trend everywere from last few years. Lot of new traders and investers start ingesting in crypto. In crypto only that trader will got successfully who have lot of technical information of charts and patterns. Every trader should take enough information regarding charts and patterns before investment. Thanks to steemit Crypto academy for providing lot of lectures regarding Crypto. There are lot of indicators in Crypto MACD is one among them.
What is the MACD indicator simply? Is the MACD Indicator Good for Trading Cryptocurrencies?Which is better, MACD or RSI?
Macd was developed by Gerald Appel. MACD means moving average convergence Divergence. MACD indicator is an oscillator type indiactor that means it moving like oscillatory motion. MACD is used to determine momentum of Cryptocurrency. It shows relationship between two moving average's of price. MACD indicator is used by most of successfully traders.
MACD is generated by subtracting two exponential moving averages to crate the main MACD line. MACD consists of three components one MACD line , signal line and the histogram. MACD line is calculated by subtracting 26d EMA from the 12d EMA.The MACD line moves above and below the zero line.
yes absolutely MACD indiactor is good for trading if trader has enough information about this indiactor. Every saucesfull trader takes entry and exit at a perfect point MACD gives a good information about these things. It gives signals regarding trading. Besides macd indicator trader has to put other charts into consideration before trading as those are also important for trading.
RSi and MACD are both indiactor , RSI is simple it consists of only one line which shows the recent price and recent highs and lows of any particular asset doesn't give a depth information as given by MACD indicator. MACD indiactor consists of three lines which i tell above. These three lines during movement gaves a good information wether to take entry or exit from that asset. MACD is better than RSI but MACD is tough to understand as compared to RSI.
How to add the MACD indicator to the chart?
As i am using binance app for trading , i will gave information regarding that app.
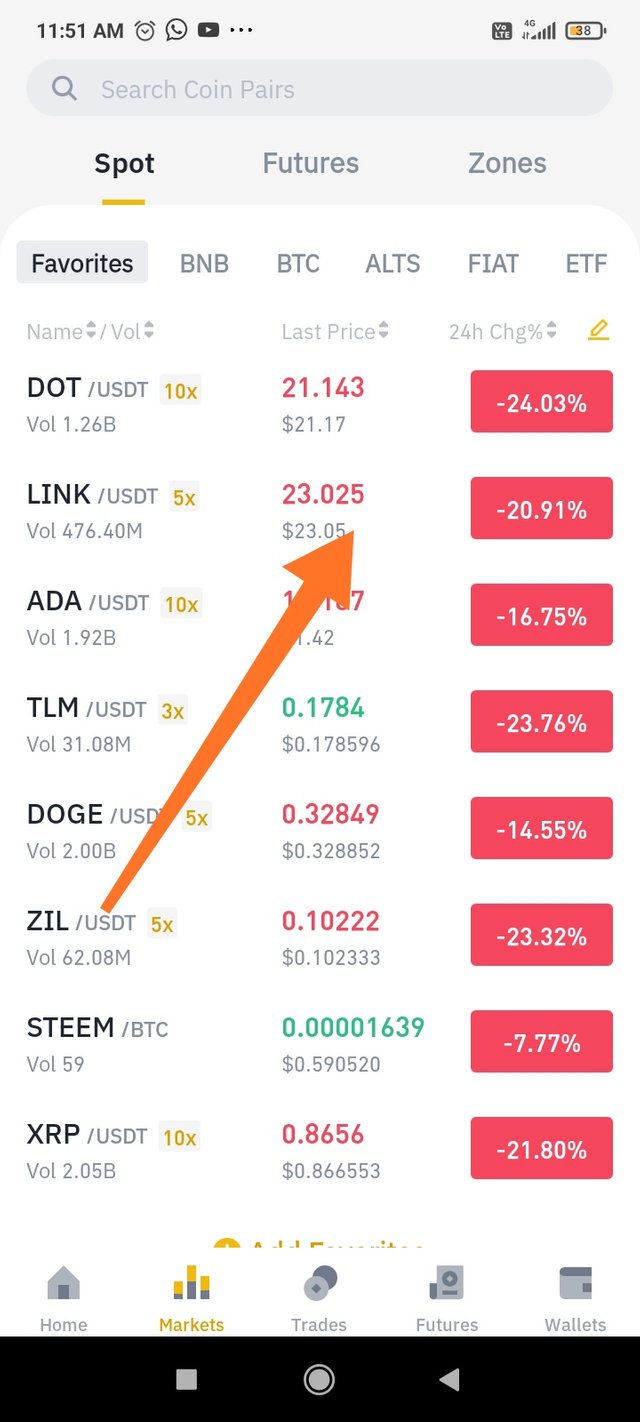
- First open the binance app.click on markets tab

- Click on any asset whose graph and indicator you want to check.
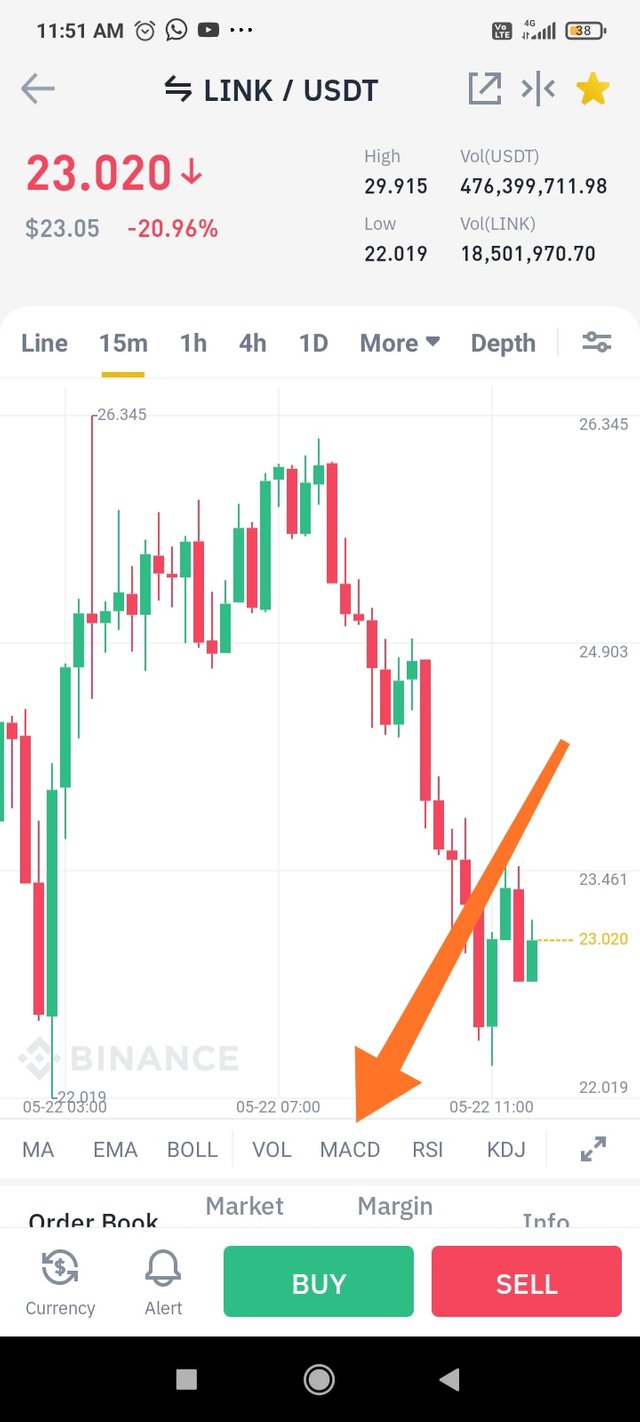
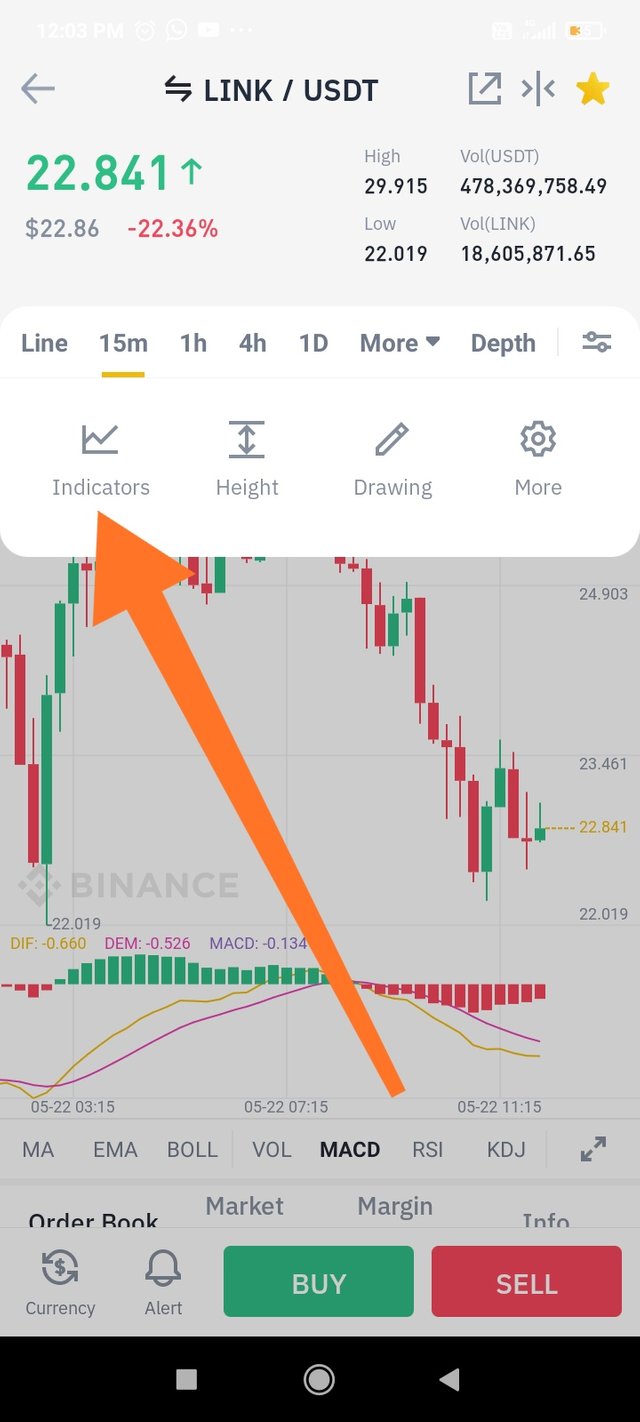
- Then click of MACD option on bottom.
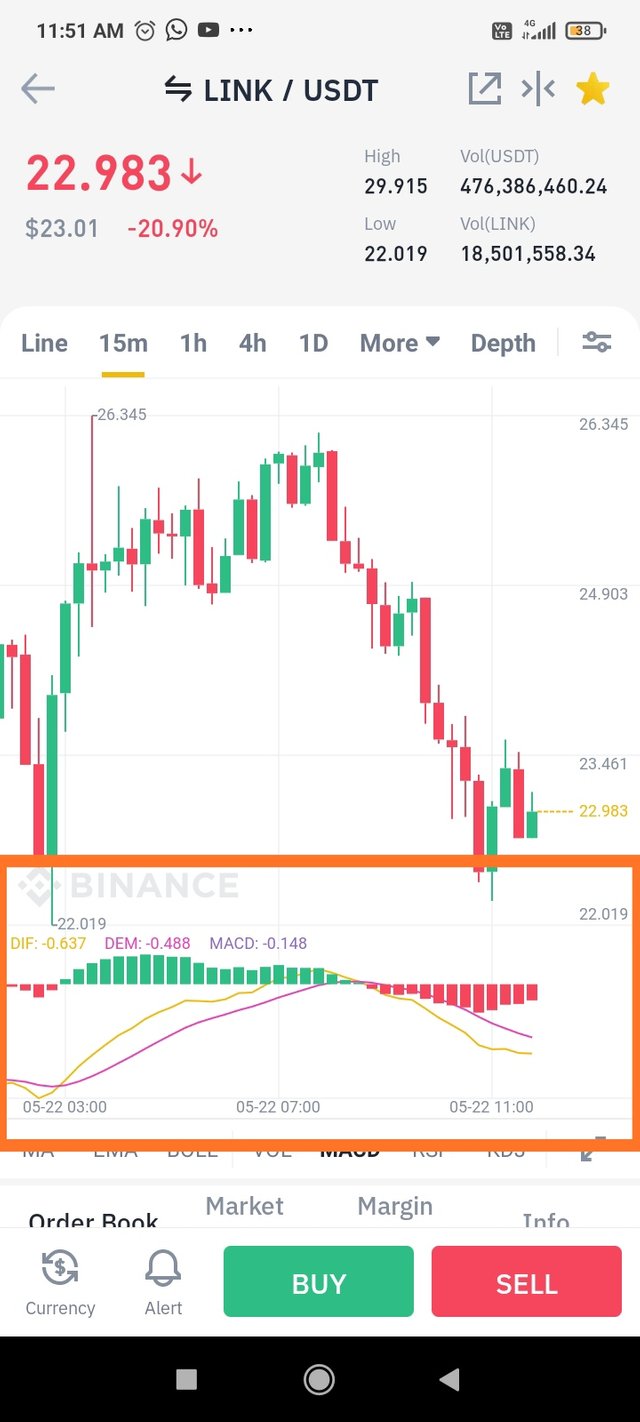
- you can check MACD indiactor has been set saucesfully
what are its settings,ways to benefit from them?
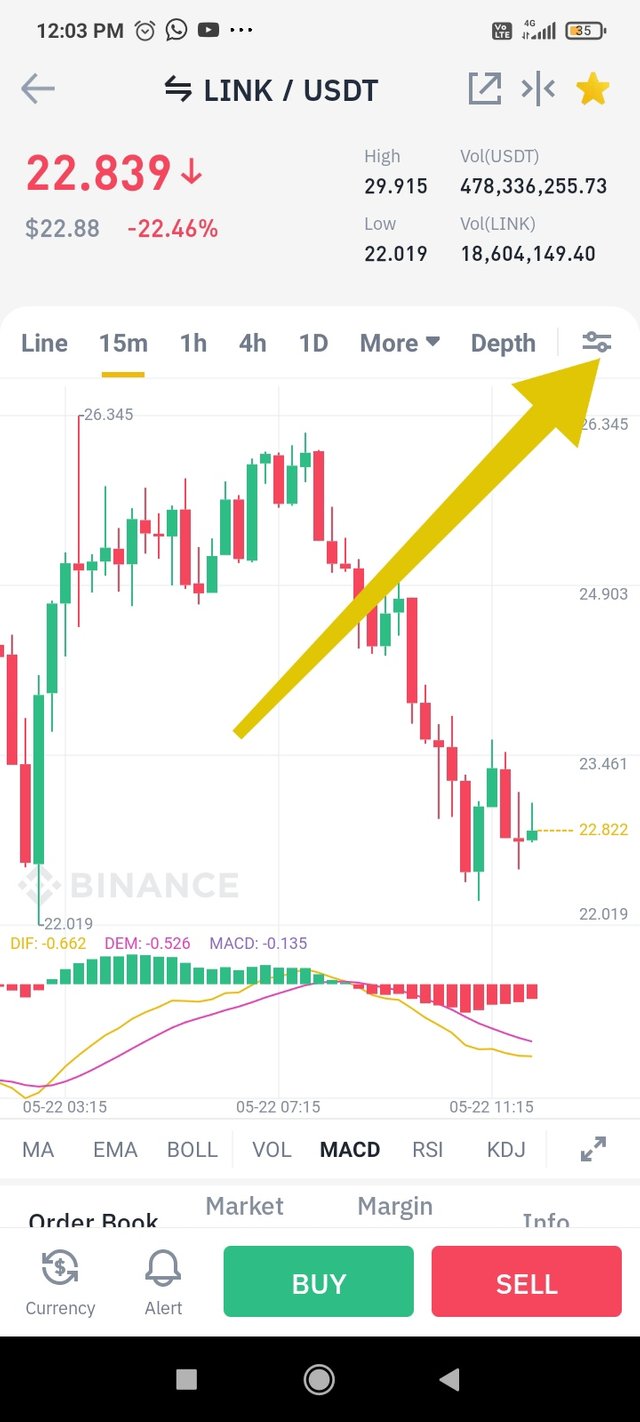
- For checking the settings of MACD indicator click on setting tab.
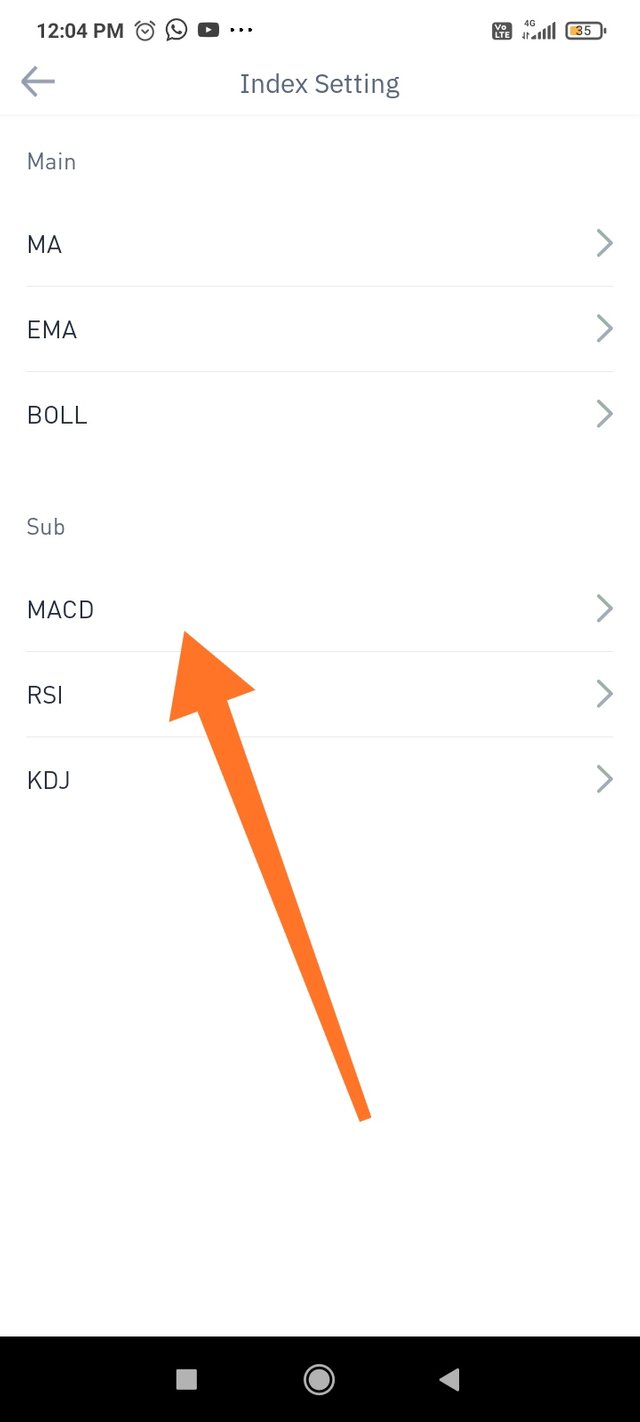
- click on indiactors.
Click on MACD .
MACD settings will open like this. there are three option , one where you can change the value of lines , second where you can bold the line and third where you can chance the colour of indiactor.
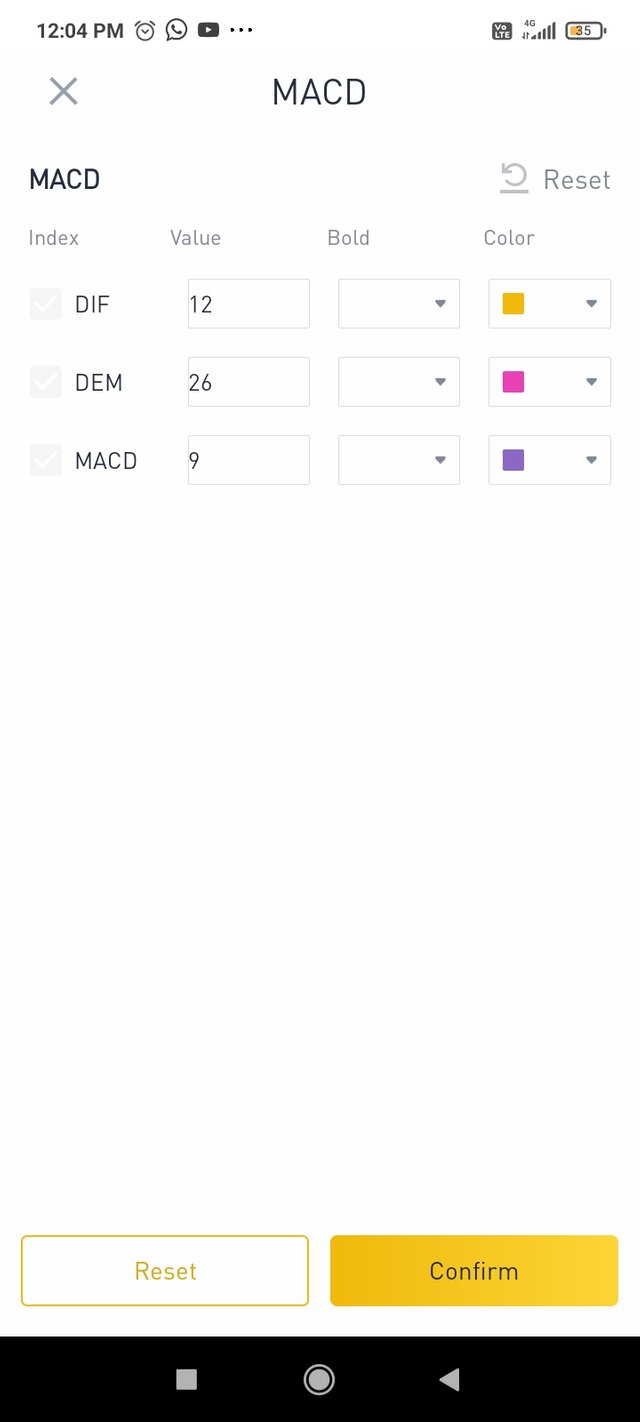
The above seeting configurations leads trade to get the indiaction lines quickly as trader can set the lines according to trader view. Also trader can see the lines easily by these settings.
How to use MACD with crossing MACD line and signal line ?
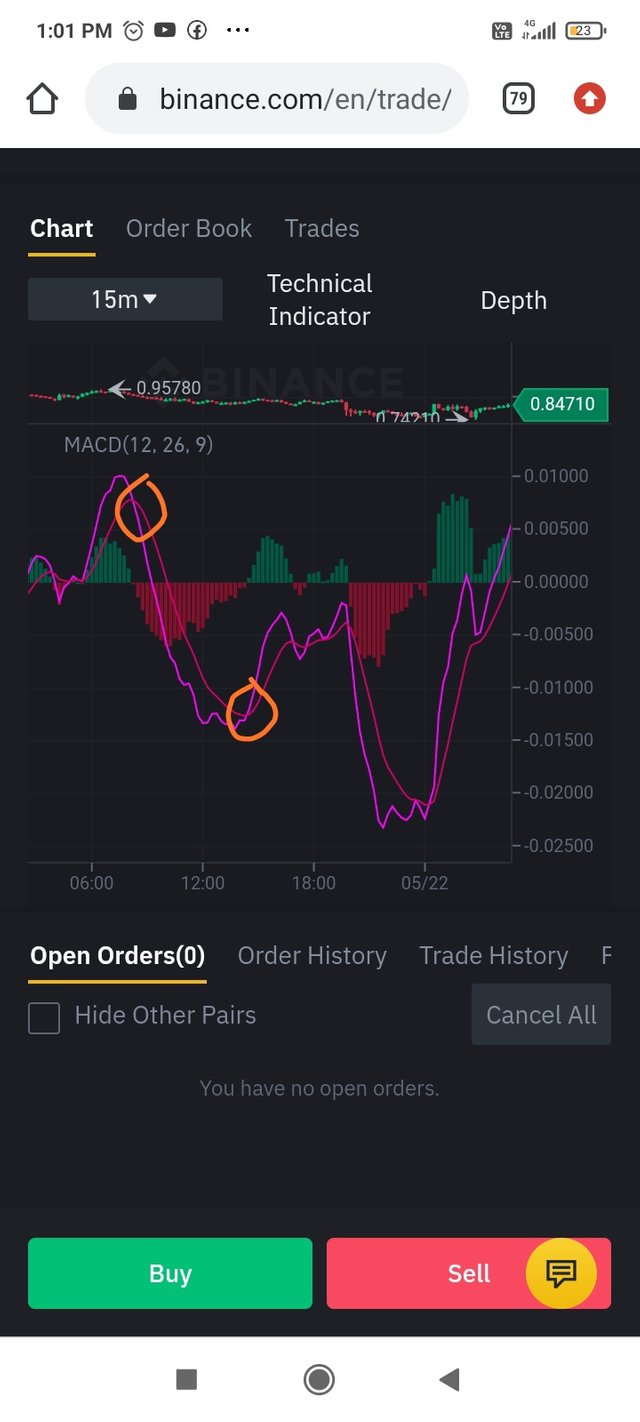
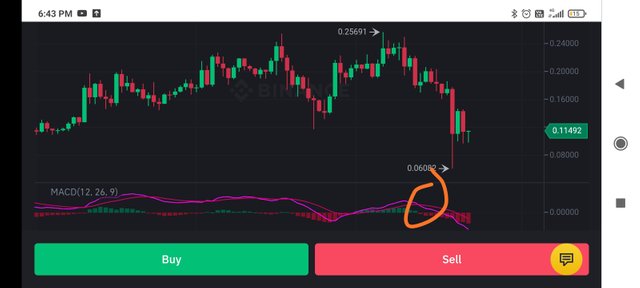
While crossing the macd line above or below the signal line it gives trader a clue or information regarding trading. In the first circle from above picture macd line crosses below the signal line that means the asset or coin will go into bearish mode or we can see price of that asset will decrese.Trader will sell his assets at this condition. When the macd line crosses above the signal line shown in the second circle that means the asset will go into bullish zone or its value will increase. So trader will take re-entry or new entry in this asset.
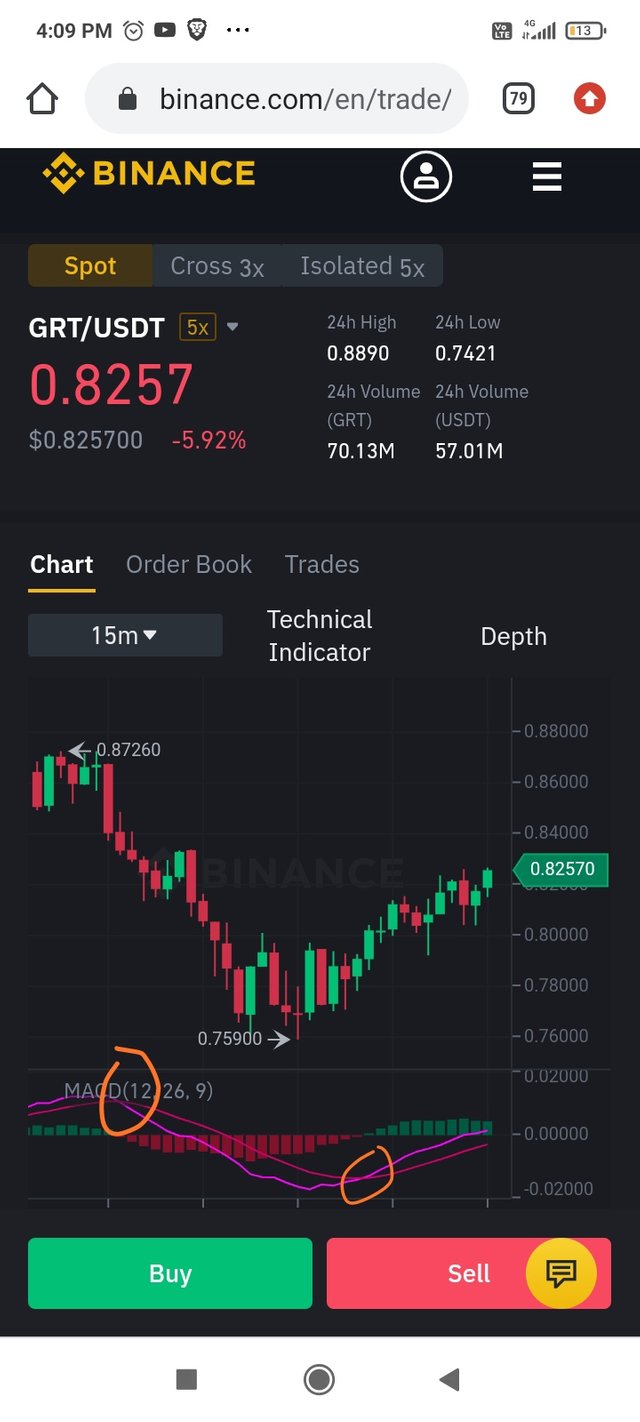
See the above example of grt coin when macd line crosses below the signal line its value decreases also when macd line crosses above the signal line its value increases.
How to use the MACD with the crossing of the zero line?
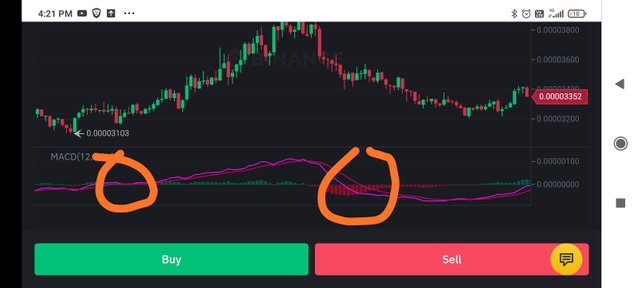
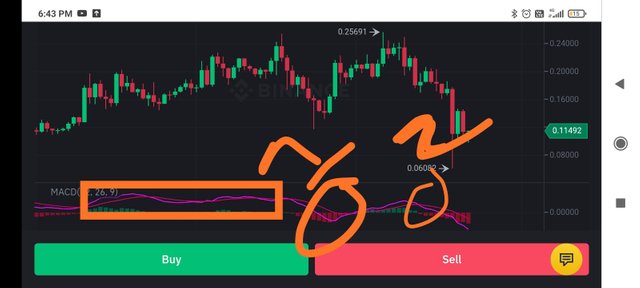
When the macd line crosses zero line upwards from the below as shown in the first circle . it gives investor a signal that now the value of this coin will increase that means trader will buy this coin at this point. When the macd line crosses zero line downwards from the above as shown in cricel second it gives single that value of this coin will decrease so trader will sell his assets. You can see from the below example of zrx coin when the macd line crosses zero line upwards from the below its value have increased also when macd line crosses zero line downwards from the above its have have decreased.
How to detect a trend using the MACD?How to filter out false signals?
MACD indiactor consists of three components as i already tell one is zero line , signal line and histogram. These are can be used separately as indicators we can check the condition of market by either histogram or any component from the above so MACD consists many indicators. We can detect trend by three ways one is from the histogram, other is while crossing zero line and third is while crossing signal line.
First how to detect trend by looking on histogram, the histogram consists of two coloured lines red and green lines as shown in above. When the coin starts moving into the bullish trend the green bars starts making these will start growing in height. In this trend value of coin increases . then the green bars will start decreasing to the base line. In this trend trader can take entry in the start of green bars and take exit when the green bars start going shorter or when it reaches to base point. When the coin goes into bearish trend the red bars will start making these will grow same as green bars from begging to top and then will move to base line. Trder will take entry at the top of red bar. After the bearish trend we will see once again bullish trend. We can see from the example during bullish trend by looking into histogram green bars start forming below to top and then back we can see during this price has increased. While during bearish trend red bars start forming from low to high and then back to base , during this price has decresed in this asset.
I have explained the remaining two trends of crossing zero line and signal line above.
Now how to filter out false signals, we all know that every system in the world is not hundred percent efficient. Same MACD indicator is not perfect it gives sometimes false signals regarding the price of any asset. It sometimes shows reverse signals. Also it shows trends in reverse sometimes. Also it sometimes doesn't show any signal when market goes into dump. Also sometimes the histogram converts into bullish or bearish with only few bars or we can say that histogram changes from red to green unexpectey so if trader make entry while seeing green bars forming but suddenly red bars start making can give trader a loss. For trader it is best to use other indicators while trading so that he can easily filter the wrong signals.
How can the MACD indicator be used to extract points or support and resistance levels on the chart? Use an example to explain the strategy.
For this you should know what is support and resistance . Also every expert talks about support and resistance while talking about the value of any assets. These two indiactors are vary famious as well as used indicators in Crypto world. Support is the price level where we expect the end of downtrend of any asset or where we see the price of any asset stops falling further but if it brokes it we see a good dump in that asset. While resistance is a price level at which price start falling as we see interest of people selling at this stage. At resistance it pushes back the price of any asset but same if resistance brakes we see a good up trend.
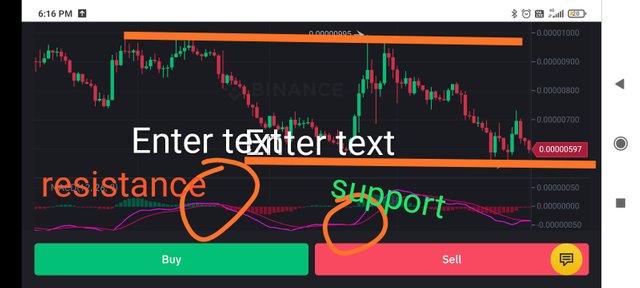
I have taken the example of Carnado , i have highlighted the support and resistance points by MACD indiactor. I have established the resistance by joining the tops of up trending price peaks and established the support level by joining the tops of down trending price peaks.
Review the chart of any pair and present the various signals from the MACD.
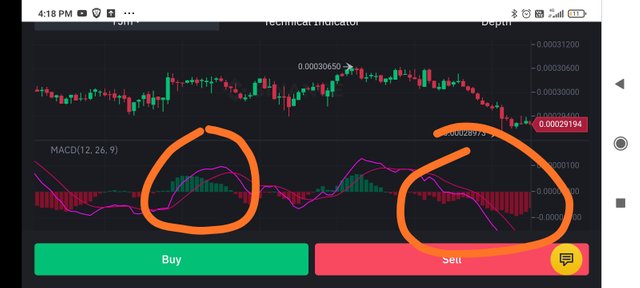
I am focusing on zilika/usdt chart of one day. You can this time the macd line have crossed above the signal line form circel one , now it will go into bullish trend so this is right time to buy zil at that stage. Also we can see histogram is in red zone that means it is below the zero line. Also red bars of histogram have gone to peak and now it start going to down. After that we will see a green bars so this time its right time to buy this asset. From circle second we can see macd line crosses below the signal line now price of zil will go into bearish trend its right time to sell zil. Also inside box we can see macd line and signal line crosses each other many times in. Price didn't change during that period that much.
Conclusion
MACD indiactor gives lot of information regarding trading like where to take entry and where to take exit. But besides MACD indiactor trader have to focus other indicator while trading.
Thanks for reading.
I invite @kouba01 check my homework task
Hello @alexcarlos,
Thank you for participating in the 6th Week Crypto Course in its second season and for your efforts to complete the suggested tasks, you deserve an 7/10 rating, according to the following scale:
My review :
A good article in which you have clearly answered all the questions. You have not deepened the analysis of a few points but roughly I appreciated what you presented.
Thanks again for your effort, and we look forward to reading your next work.
Sincerely,@kouba01
Thanks for checking my post.
You have been upvoted by @sapwood, a Country Representative from INDIA. We are voting with the Steemit Community Curator @steemcurator07 account to support the newcomers coming into Steemit.
Engagement is essential to foster a sense of community. Therefore we would request our members to visit each other's post and make insightful comments.
Thank you.