Crypto Academy Week 10 - Homework Post for professor [@stream4u] on price forecasting.
Hello Professor, I am very happy to be a part of your class and this is my homework solved below thank you.
Solution
Before I proceed to answer the question "what is price forecasting?" let us first understand what forecasting itself is all about.
In simple terms, I will say forecasting is all about predicting future events, this is done to enable us to get control and plan our future and also take precautions and prepare very well for the task again. The forecast can long term, medium term or short, normally the longterm forecast takes beyong many years and the medium term forecast is just within a year or two , the short term is a day, week or a month. Forecasting is required in so many fields of which include marketing, finance and risk management, economics and many more.
Now let us narrow our concern to the topic of the day which is price forecasting. From the definition of forecasting stated above, I will say price forecasting simply means trying to predict or calculate the future prices of assets or any comodity in the market. Inorder to manage our assets properly and to avoid any financial loss in the market, it is necessary for us to check the volatility of prices and to predict it so we can capitalised on our investment. Price forecasting can be apply to both short and longterm investments. Price forecasting can be said to be more useful in the fields of marketing, finance and investments, example, in trading digital currencies or cryptocurrencies, it is important to understand the movement of prices from the support level to the resistance level and even know the possibility that there will be a price break through.
source
Solution
Price forecasting is so important to the extent that one have to clearly understand it before stepping into trading, especially on the cryptocurrency market so as to guarantee his/her success. Price forecasting helps investers or traders to earn more on their investments and at the same time eschewing huge losses on their investment and capital. Investment or trading do not multiple by itself, it needs to be manage and know when to exit and when to hold on also when to buy and when to sell. All these can be done very well when it is necessary to predict the future price of your investment, also, inorder to make profit on your investment and avoid huge losses, it is very necessary to be able to predict future prices. Price volatility is when price move up and down or flutuate and it is mostly as a result of the demand and supply of that asset or comodity, we need price forecasting as a guideline to direct us in our investment. Price forecasting makes multiple trading possible, when we are prevy to the movement of future price, we can capitalised on the movement between the support and the resistance level on the price chart. This is done by buying at the support level and selling at the resistance level to make a profit, and waitng till the price decline to the support for you to transact again. This is only possible if future prices can be predicted hence the need for price forecasting.
Solution
In answering the question as to which method is the best, let us first go through the methods use in analysing price forecasting.
This method uses quatitative data to predict future price of an asset, this data is mostly historical data of the price of the asset to determine the trend price. In this method, we can talk about the chart pattern which indicates the patterns or lines of price movement on the price chart. This is a technical analysis of price movement and it can be use to predict future price, base on previous chart pattern we can forecast future price. Let us look at the support level and resistance level for instance, In the price market analysis especially the digital currency market, technically, support levels and resistance levels are certain predetermine levels of the price of an asset at which it is assumed the price will tend to stop and reverse. These levels are denoted by multiple and several touches of price without a break through of the levels. Base on this method, bears and bulls on the trading market make decisions, bears are traders who belief prices will fall and so want to eradicate their assets by selling it off whereas bulls are traders who belief prices will rice and so they but more assets with the aim of making profit.
In this method, market price of an asset and studying the trend of prices is not taken into consideration. The main element or tool for analysis is the managerial performance the company, that is, how policies are implemented in carry out to ensure development in the company. The healthy performance of the financial statement of the company also play a role, the good looking of the balance sheet, income statement and the cash flow statement figures are of much interest in this method of price forecast analysis. The production line of the company is also considered, that is, the kind of product produced into the market . If all these areas are looking promising and execellent then investors or traders will go ahead and invest in the company.
Traders or investors in this kind of market always respond to the volatility in price instigated by information about the performance of market variables which intend create panic in the market. These predictions are communucated on various platforms of which include forums, news and also discussions from panelists and experts. These predictions of the volatility of the market can lead to making profit or loss, if currently predicted, investors can make a lot profit but investors will huge loss if it is predicted wrongly. In this method, investors try to understand each other sentiment whether it is favourable or not fovouable and make decision base on that, they want to know what the general traders are thinking of the market and what is happening in the market and try to capitalise on that.
Now to answer the the question of which one is the best, I will go for technical analysis method. From the above explanation, it is more reliable when it comes to predicting price of an asset. It has showed durability over the years in predicting price. This is because it uses quantitative data and positive analysis rather than value judgement and being subjective when it comes to price forecasting.
Take any Crypto Asset Chart graph and explain how to do Price Forecasting? OR Take any Crypto Assets Chart graph & as per its current price tell us what will be its future price for next 1 week or 1 month? You can predict for any direction up or down but explain it properly on what basis you have predicted the price.
Solution
In my price forecasting below, I will try using techical anaysis to predict the price of TRX/USDT for the next 30 minutes using the trend movement, the structure of support and resistance levels and and 20 period moving average indicater.
Step 1.
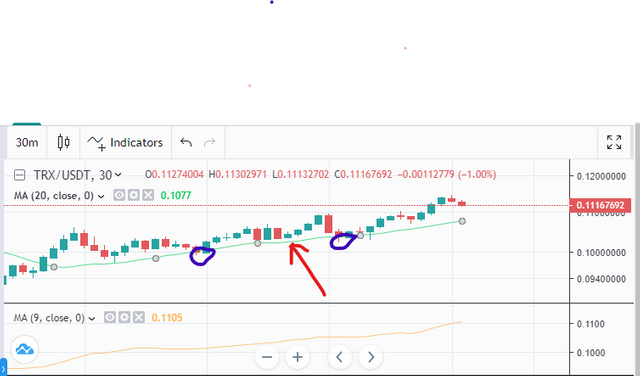
In the above diagram, I mention a 20 period moving average indicater, this is the line indicated by the red arrow. The 20 period moving average is the average moving of price over certain period of time, it is a very important indicater when it comes to price forecasting on the price chart. First of all, I will try to identify or find my trend and some area of value on the price chart and the reason for that using the moving average indicater.
The trend for my price chart above is an uptrend, meaning price is moving up. The reason being that price are above the moving average, if prices are below the 20 moving average then it is down trend. In this case, prices are above so it is a uptrend.
The area circle with the blue line indicates the the area of value for me, this is because that is where the trend touches the moving average.
Step 2.
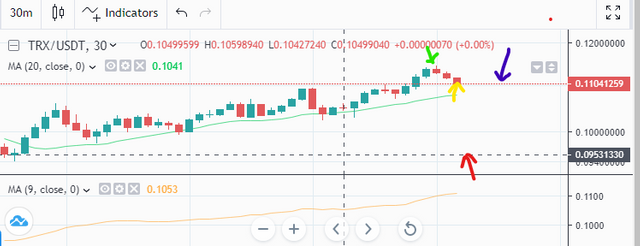
Now the support and resistance levels are indicated by the red and blue arrows respectively, but in this case, we can see the resistance level becoming the new support level after a break through. At the green arrow, there is a price decline so it is advisable to exit the market at this point and wait to enter the market at the new support level which is indicated by the yellow arrow. The reason being that prices are likely to reverse torward the new resistance level when it hit the support level.
In conclusion, from this simple price forecasting analysis, I am very sure my prediction will be right. Thank you.
I would like to thank professor @stream4u for taking us through the class, I have actually learnt something very new and can not wait to meet you again at your next class.
Hi @albertodecrutor
Thank you for joining The Steemit Crypto Academy Courses and participated in the Week 10 Homework Task.
Your Week 10 Homework Task verification has been done by @Stream4u, hope you have enjoyed and learned something new.
Thank You.
@stream4u
Crypto Professors : Steemit Crypto Academy
thank you for evaluating my homework and I will work on all the recommendations stated to improve myself.