Crypto Academy Week 14 - Homework Post for [@fendit] || Elliott Wave Theory.
Hello everyone, it is of great pleasure that I invite you to another Steemit crypto academy post of mine, and this time, I will be writing to on @fendit assignment after reading the topic "Elliott Wave Theory". As I write with respect to the assignment, I hope you enjoy it as you read.
What's the application of this theory?
Elliott Wave Theory, published by Ralph Nelson Elliott in 1938, is applicable to any financial asset which is freely traded in a market. The principle deals with human behavior in the market. "It states that the psychology of investors and the momentum of the prices changes result in the movement of the market".
The use of Elliott wave theory allows for the determination of the possible level of corrections and benchmarks in a chart. Understanding the trends in a chart is very important when trading financial assets, and being able to figure out the future direction of the trend in the chart. Do not forget that a trend is a combination of highs and lows which means either an uptrend or a downtrend, there are highs and lows. Uptrend with ascending highs and lows while downtrend with descending lows and highs.
You need to understand that this is a theory and not a law which means it would not always be 100% correct but then it is very useful for traders to know this.
What are Impulse and Corrective Waves?
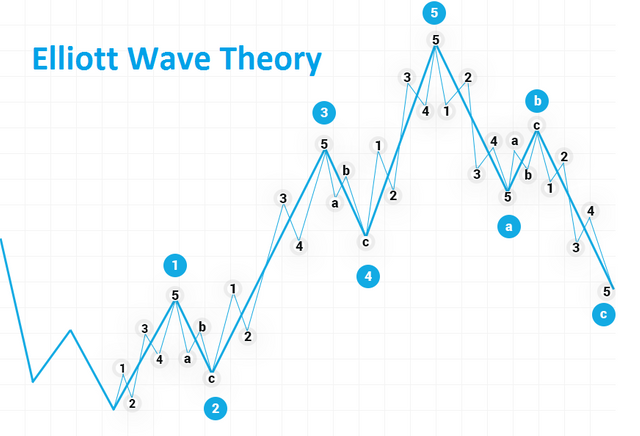
Elliott wave theory has eight waves to complete a circle, five upward/upside waves, and 3 downsides/downward waves, The Upward waves are regarded as impulse waves while the downside waves are regarded as Corrective waves.
The theory explains that the waves have different reasons but before explaining, let me give a quick explanation of the moves. 1, 3, and 5, are impulse waves, 2, and 4, are descending waves, and A, B, C are correction waves. It is said that wave 1 is a result of various factors surrounding the asset including price (cheap), as well as time which leads to buying of the asset. Wave 2 is a period for early investors to cash out /take profit but this doesn't affect the price to getting to its original point. Wave 3 is when traders get to know the instrument which allows it to create higher highs. Wave 4 is another point to take profit but it low remains high. Wave 5 is the point when investors and traders believe that the asset/instrument is overbought and then three correction waves “a”, “b” and “c” follow.
How can you easily spot the different waves?
Identifying the waves can be very difficult since a chart is a continuous line of trends but then, to identify the Elliott Impulse and Corrective waves, the wave has to be eight in number. Do not expect that the 8 waves wouldn't have micro-waves, each wave will be divided into smaller waves of 5 and 3 respectively (not compulsory), with 1,3, and 5 having the 5 micro-waves while 2 and 4 have 3 micro-waves. The correction wave has also 5 and 3 micro/smaller waves respectively.
- To identify an Elliott wave, one need to find a base first.
- Wave 2 cannot be go below the starting point
- Wave 3 should be a longer wave compared to 1 and 5, it can not be the shortest of the impulse waves.
- Wave 4 and wave 1 cannot be on the same line.
- Wave 5 should be accompanied with a correction.
- The number of waves counted determines what happens in the market.
What are your thought on this theory? Why?
Elliott wave theory is more of a psychological theory. It just deals with human behaviour as well as emotions. The theory doesn't have to be true but because it has been stated and traders learn about it, it now toys with the emotions of traders giving them the impression that after a 5 wave, there would be a correction leading to an immediate pullout of funds from thr market. Although, I have always said that the market is emotional and Elliott wave just proved it.
Choose a coinchart in which you were able to spot all impulse and correct waves and explain in detail what you see.
BTC/USDT
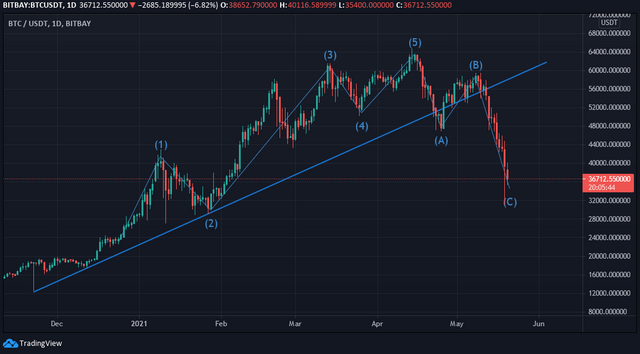
To explain in details the Elliott wave on a coinchart, I will be using the BTC/USDT trading pair and will be making use of tradingview to study the chart. I will be explain the steps in detail.
- First, I picked the trading pair (BTC/USDT) and explored the trading graph
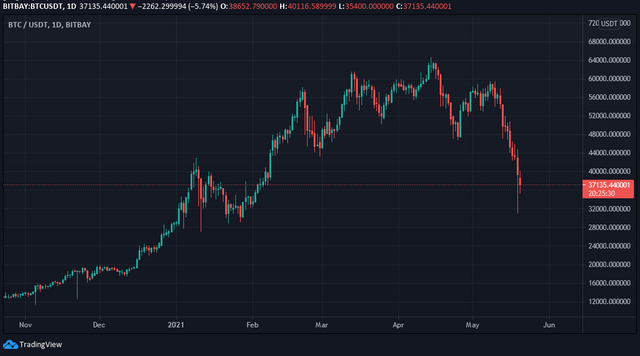
I used a 1 day timeframe graph.
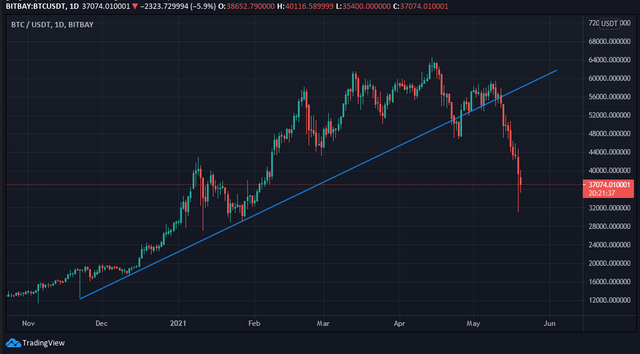
I usually like to check the trend of a chart (do not forget that the basis of trading is trend). I draw a trend line. A trendline would touch two or more candlestick points. Market prices move in trends as they are freely traded.
- I would find a starting point 0 and this is where I would start the Elliott wave. I used the Elliott Impulse wave (12345) for the impulse wave.
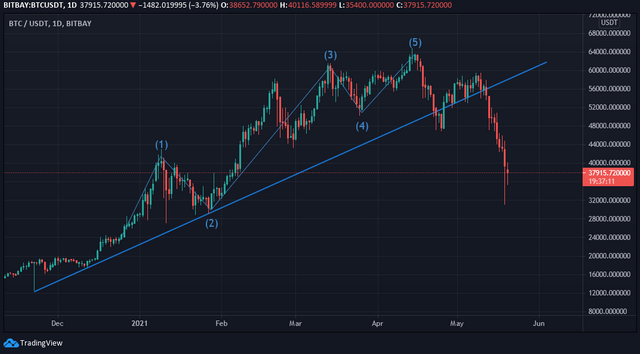
- To get the corrective Waves, I used the Elliott correction tool (ABC). I started the corrective waves from point 5.
Conclusion
For me, I see the Elliott wave as a psychological technical analysis which just predicts the market behaviour and allows the market play to its tune. It deals with emotion which makes it very effective. Thanks @fendit for the opportunity to participate in this assignment.
Thank you for being part of my lecture and completing the task!
My comments:
Nicely done :)
Explanations were fine, but I really liked that you showed step by step how to identify the pattern, that's certainly a great idea :)
For next time, make sure you focus a bit more on applying markdowns as that helps the overall score!
Overall score:
6/10
Thanks a lot professor