Steemit Crypto Academy | Season 3: Week 5 || Death cross & Golden cross, How to use Binance P2P trade by @ahsanjawed
Steemit Crypto Academy || Season 3: Week 5 || Death cross & Golden cross, How to use Binance P2P trade || For @yousafharoonkhan by @ahsanjawed

⚡ Death cross & Golden cross
⚡ Question no: 01

⚡ Death Cross
A death cross is a graphic pattern that signals the end of a bull sector and the beginning of a bear one. When a security's short-term moving average (for example, the 50-day) crosses above or below a long-term moving average, this technical indication appears (e.g., 200-day).
During the 2000 Dotcom crisis, the NASDAQ 100 Index formed a death cross, as shown in the figure below.
The pattern's claimed potency as a bearish signal gives rise to the indicator's name. In other words, when a bearish moving average crossover happens, traders who trust in the pattern's dependability declare an asset "dead."
⚡ Example
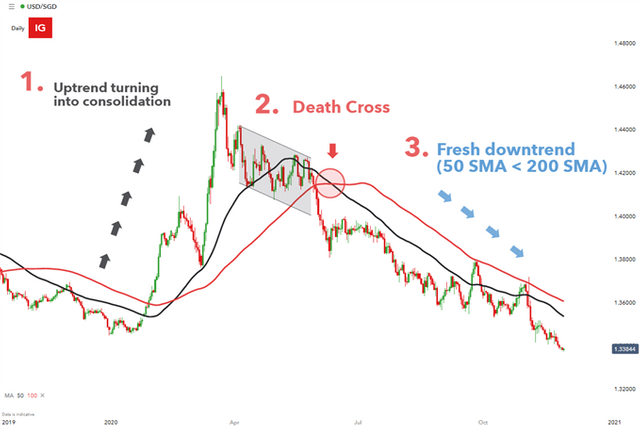
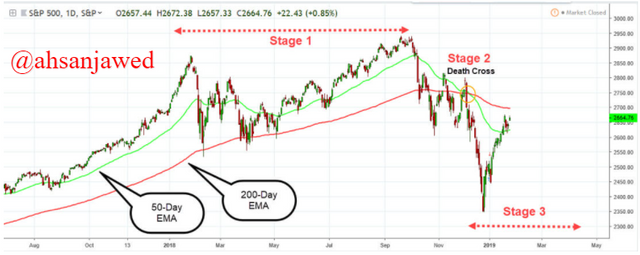
The chart below accurately depicts the many stages of a developing downward trend. You should pay special attention to the region inside the box. As you can see, the index had been locked in a trading range for a while until sellers gained control and pushed it down. Surprisingly, the crossover phase occurred just after a significant sell-off. Then came a few days of stabilization, followed by another strong sell-off and further consolidation.
⚡ Golden Cross
When a short-term moving average crosses over a significant long-term moving average to the upside, analysts and traders see it as a decisive upward move in the market. Basically, until they cross, the short-term average rises faster than the long-term average.
A falling tendency that will ultimately come to an end once the supply of goods available for sale has been depleted. The shorter moving average crosses up through the larger moving average in the second stage.
Finally, the upward tendency is expected to continue, resulting in greater pricing.
⚡ Example
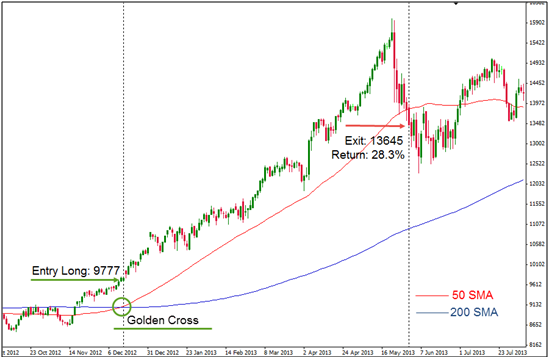
We'll look at a Golden Cross and how the trend may develop. As an example, we'll look at the E-Mini S&P 500 Futures. Take a look at the graph below. The green line (which represents the 50-day moving average) crossed over the blue line. In July, the latter represents the 200-day moving average.
The index swiftly recovered after falling below the 200-day moving average, as shown by the shaded region. The Golden Cross wasn't officially verified until late October/early November. While investors who bought E-Mini S&P 500 Futures at any point during the consolidation period would have gained money, it would have been a risky strategy.
⚡Death cross
The Death cross is a financial graph pattern that warns a significant sell-off is imminent. A death cross shows on a chart when a stock's short-term moving average crosses below its long-term moving average. The 50-day and 200-day moving averages are the most popular moving averages employed in this pattern.
⚡Golden cross
Many brokers and market analysts are suspicious about the Golden Cross as trustworthy trading indicators. Their main issue is that the Cross pattern is often a very sluggish indication. The market bottomed out and moved upward at a market price much below the Golden Cross, as shown in the chart above. For traders, the Cross pattern may have little predictive power and maybe more helpful as confirmation of an uptrend rather than a trend shift indication.
⚡ Death cross & Golden cross
⚡ Question no 2:
⚡ How many days moving average is taken to see Death cross and Golden cross in market for better result and why?
⚡Golden cross
When new traders begin trading, they frequently struggle to understand the various periods on charts. Traders can use time frames to concentrate on micro or macro price activity. To put it another way, day traders concentrate on smaller time frames (5m, 15m, 30m, etc. ), whereas swing traders and position traders concentrate on larger time frames (4h, 12h, 1D, etc.). Moving averages may assist you in better identifying price patterns across a variety of time intervals, thus the golden cross or death cross comes into play here.
⚡Death cross
Time frames, in a nutshell, assist traders in focusing on micro or macro price activity. To put it another way, if you're a day trader, you should concentrate on shorter time frames, but swing or position traders should concentrate on higher time frames. Moving averages, such as the golden cross, death cross, and silver cross, can help you better detect price patterns across various time intervals.
⚡ How to see death cross and golden cross on the chart.
⚡Death cross
The creation of the death cross is divided into three parts.
- The build-up: After a long period of moving higher, price action consolidates or, in some cases, reverses abruptly lower.
- The death cross: The 50 SMA crosses below the 200 SMA at this point, creating a negative background for the market known as the death cross.
- Continued downward momentum: Following the death cross, price action frequently moves lower, establishing a new trend (downtrend)
⚡ Explain Death cross and Golden cross on the chart, (screenshot necessary)
⚡Death cross
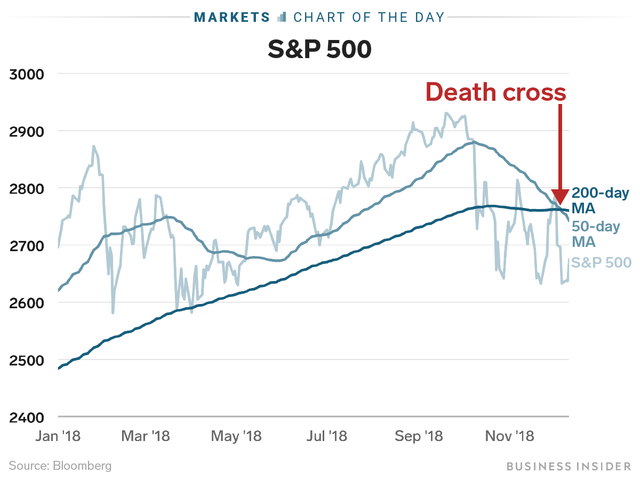
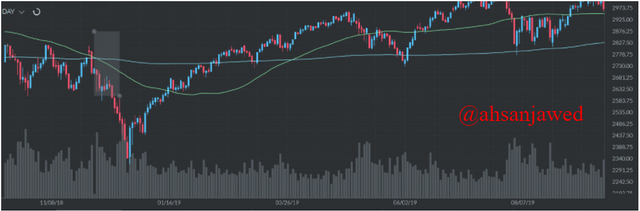
The S&P 500 is a stock market index comprised of the market capitalizations of 500 of the largest corporations in the United States. The death cross has occurred numerous times in the history of the S&P: 500, and the 34th death cross (from 1950 to February 2019) occurred recently. On the S&P; P 500 daily chart in late 2018, we showed three stages of the death cross in the figure below.
⚡Golden cross
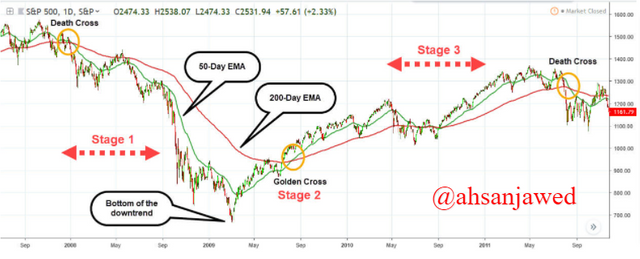
When the death cross occurs, the upswing will finally come to a stop. The death cross, on the other hand, happens when the 50 MA (short-term moving average) crosses below the 200 MA (long-term moving average).
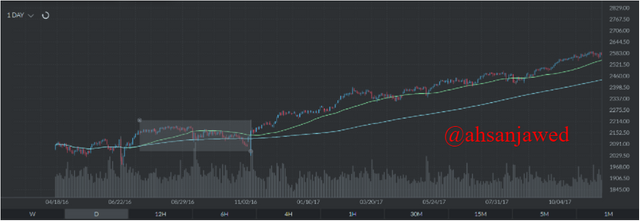
During the 2008-2009 financial crisis, we depicted the S&P: 500 daily chart in the graphic below.
⚡ How to use Binance P2P trade
⚡ Question no 3:

One of the greatest ways to purchase and sell cryptocurrency is through peer-to-peer trading. Binance P2P was developed to provide P2P traders with a safe, simple, and affordable way to purchase and sell bitcoin. One of the finest methods to trade is always waiting for you, with access to a large selection of verified P2P advertising from across the world.
⚡ How to transfer cryptocurrency to p2p wallet?
See the steps.
⚡ Step # 1
First of all you have to open your Binance Wallet and then go to Overview.
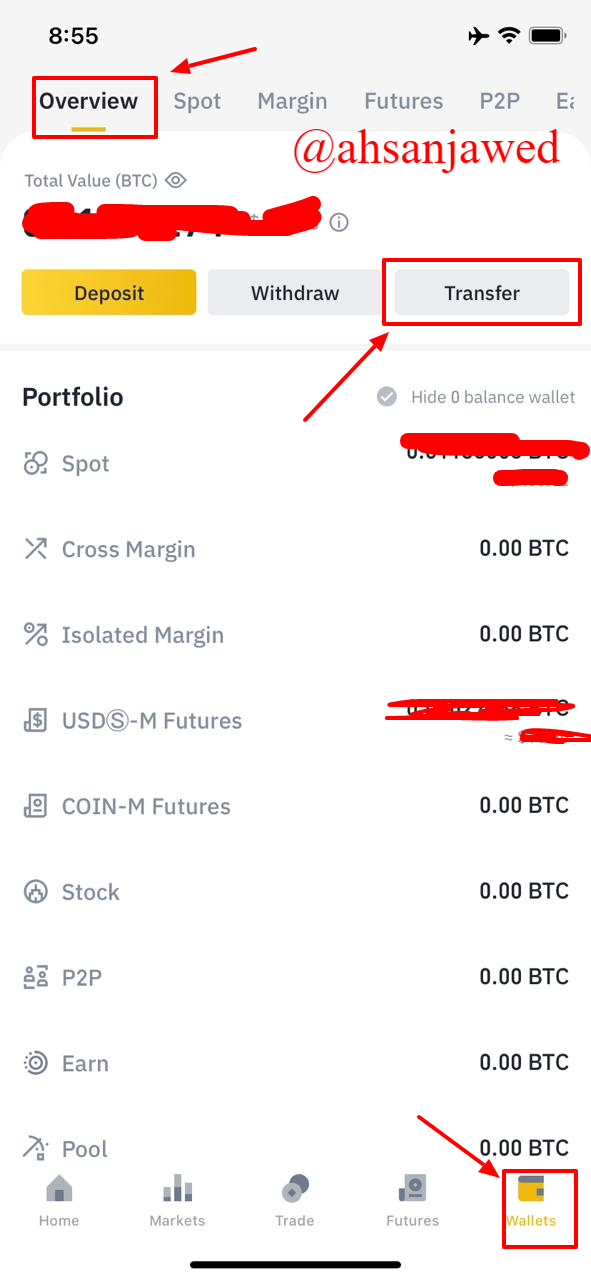
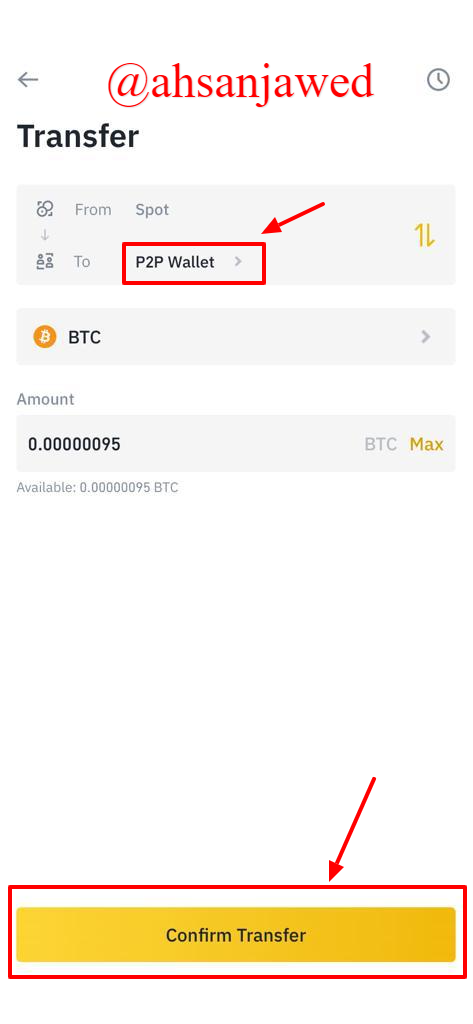
⚡ Step # 2
Select the destination, crypto type, and quantity, then click “Confirm Transfer.”
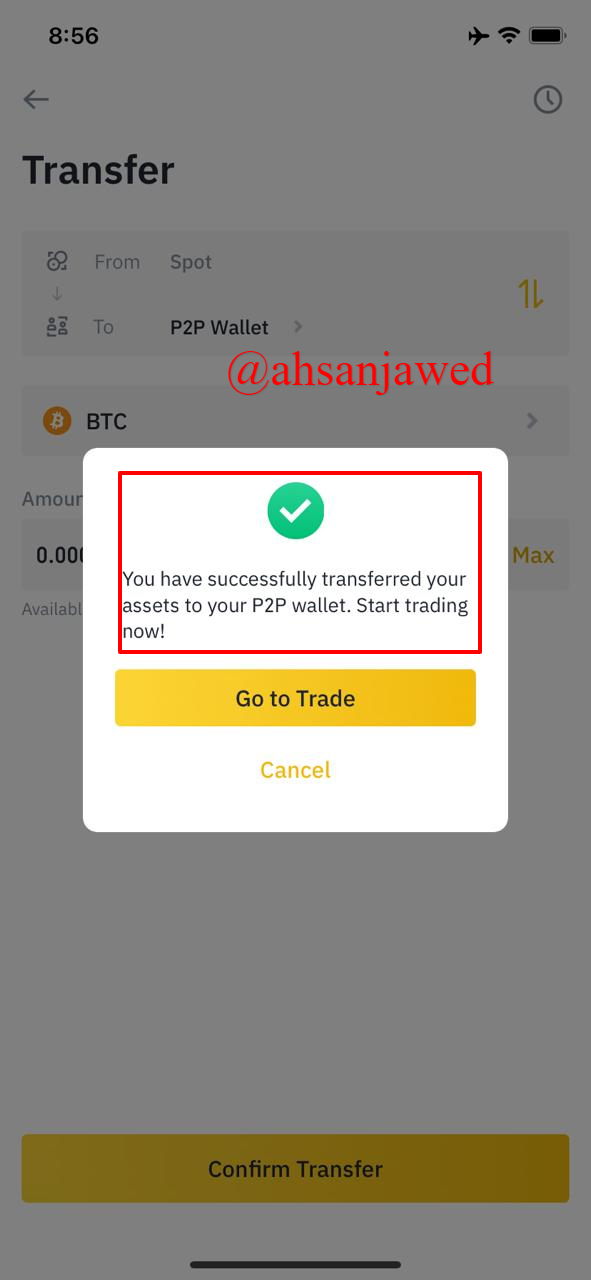
⚡ Step # 3
Here, your transfer is Done.
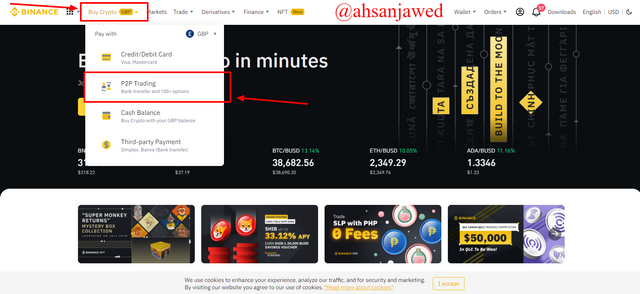
⚡Step # 1
First of all you have to login on your binance account and open p2p trading.
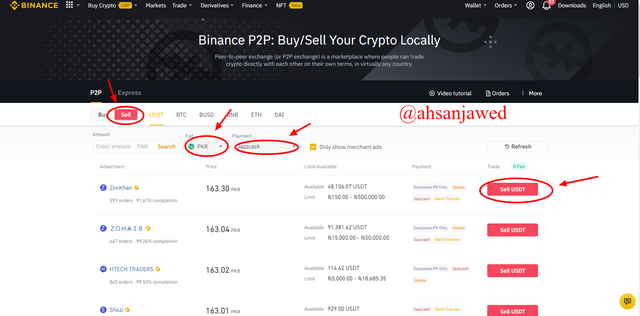
⚡Step # 2
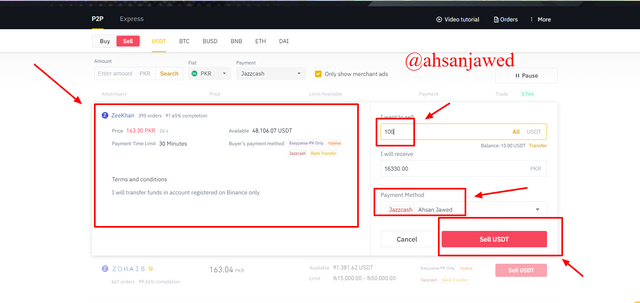
Then Click on the sell option as we want sell usdt, then select a currency , and method as here i select jazzcash, Then click on the Sell Usdt.
⚡Step # 2
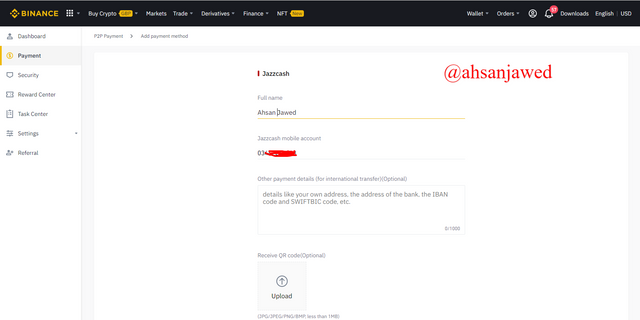
Then add your payment method
⚡Step # 2
Then select one of the exchanger i chose this one, then enter the amount you want to sell, and select payment method then click Sell usdt.And here you sell your usdt in to PRK currency and the will directly come into yours jazzcash account.
As here i don't have much amount so i can't sell it minimum amount of sell usdt is 100usdt here. and other exchangers have different minimum amount
⚡ How to use Binance P2P trade
⚡ Question no: 04
⚡ Here are some tips which you have to keep in mind while trading on p2p
- When you receive a payment in many applications, the money is transferred directly to your P2P system balance. Money stays there until you either transfer it to your bank account or spend it for another system activity. Confirm that the deposit went through if you transferred the money to your bank account. If the transfer is marked for extra review, it might take a few days or even longer.
- Because of p2p payment systems require access to your financial data, examine your account settings to see if you can turn on any additional security features that aren't enabled by default. Consider activating multi-factor authentication, requiring a PIN, or employing fingerprint recognition technology like Touch ID.
One of the main point is
- Fraudsters attempt a variety of methods to persuade you to pay them, including transferring money online, so be sure you know who you're sending money to. If you're using the service to receive money from someone you don't know—perhaps as payment for concert or game tickets, or for an item you're selling—transfer the funds to your bank account and double-check that they're there before sending any items. If you're not sure if this kind of transaction is allowed on the service you're using, check the terms of service.
Advantages | Disadvantages |
|---|---|
| * As compared to P2P exchanges like Binance, conventional exchanges may not provide as many payment methods. | * Since P2P payments can be performed very quickly once both parties have acknowledged the transaction, one party may postpone it for a variety of reasons. |
| * One of the benefits of using a local peer-to-peer Trading platform is that it connects you to a worldwide market of cryptocurrency buyers and sellers. | * Using P2P, the purchaser might change their minds and elect to terminate the transaction halfway through. |
| * Traditional digital currencies charge a set fee or a percentage of each deal, while P2P allows traders to connect and conduct transactions for free. | * P2P marketplaces are still in their infancy, and their liquidity is lower than that of controlled exchanges. |
| * Binance, as previously indicated, offers an escrow service to safeguard buyers and sellers. After using escrow to secure a transaction, money is kept by Binance and released only when both parties have satisfied the criteria of the deal. | * Bigger dealers that need to conduct large transactions may opt to employ OTC (over-the-counter) trading or purchase and sell on a traditional exchange. |
⚡ Conclusion
Hi @ahsanjawed
Thanks for participating in the Steemit Crypto Academy
Feedback
This is good work though you will need to make some correction here;
That was not well explained. You shouldn't have said "Above or below"
For a death cross the shorterm moving average crosses the longterm moving average from above proceeding downwards in a downtrend.
Thank-you Sir will surly look at your Recommendations.