Trading Strategy with “Price Action and the Engulfing Candle Pattern” - Crypto Academy / S5W7 - Homework post for @ lenonmc21

Hello fellow steemians, I am really honored to be finally able to participate in this course. My humble regards to professor @lenonmc21 for the opportunity to learn something new and really important in the world of crypto trading in general and hopefully use this knowledge to trade wise and safe I can share my knowledge learned with many others.
Q1. Say in your own words that you understand about the Trading Strategy with “Price Action and the Engulfing Candle Pattern, also describe each step to be able to execute it (Place at least 2 examples in clear cryptographic assets and with your own charts mandatory) ?

Trading Strategy with “Price Action and the Engulfing Candle Pattern is merely a tool used by most traders to help them in predicting the market trends by providing them the insights to read, analyze and understand the crypto assets charts very well to be able to make healthy decisions about the market.
It basically tells traders to observe the charts for certain movements of both the bullish and bearish trends. When one candle moves toward a direction for over a period of time and gets interrupted by a different candle it tells traders that the charts is about to change movement to the opposite direction of the first movement giving traders an opportunity to enter the market when the situation favors them. This is when the engulfing candle pattern occurs. The engulfing candle pattern is the point in the chart where traders make an entry into the market.
One important thing to note about this tool is that, it works better, more accurate with lesser time frames like 30, 15, and 5 minutes. This strategy also works together and cannot be separated as noted one can’t work without the other.
The following are the step by step guide to using the price action and engulfing candle pattern strategy.
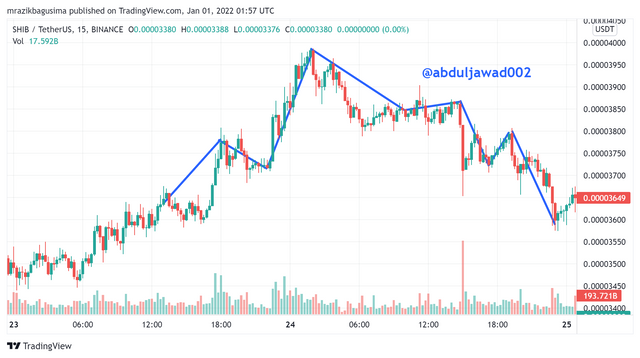
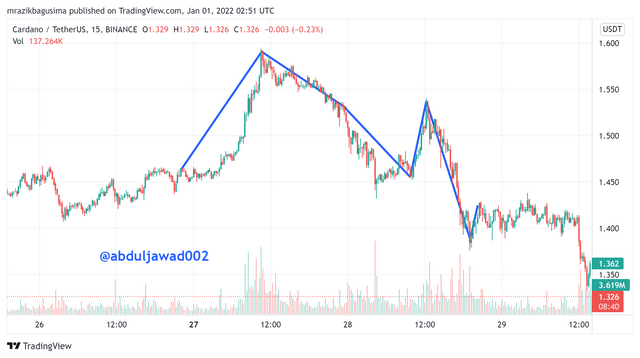
1. Identifying a perfect clear movement on the chart. You are supposed to located a particular moment in the chart where both candlesticks are moving in harmony towards one direction within a 15 minutes timeframe to be able to get clear and adequate read on the chart.
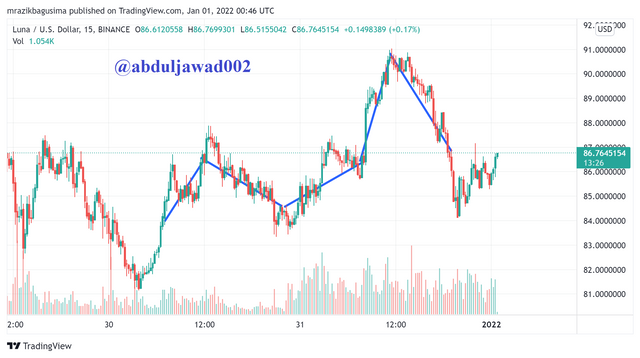
2 Look for a strong movement negating the current movement on the chart. In this next, one need locate on the chart a really strong movement which defies that of the current one. That is to say if cure trend was moving upward then you need to find a trend which moves downward from it and if the current trend is moving downward you need to find a trend that moves upwards.
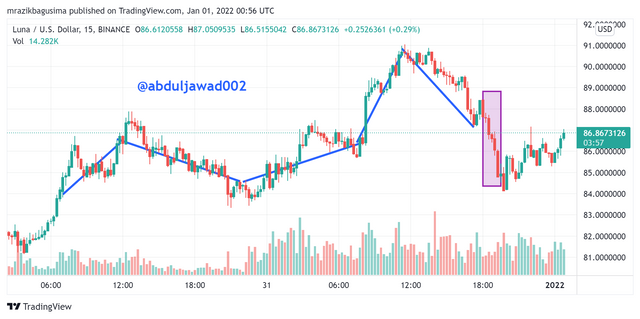
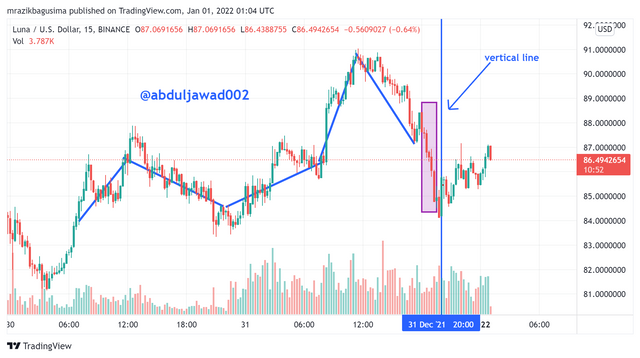
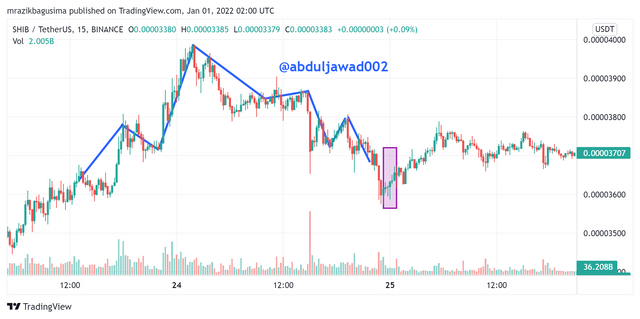
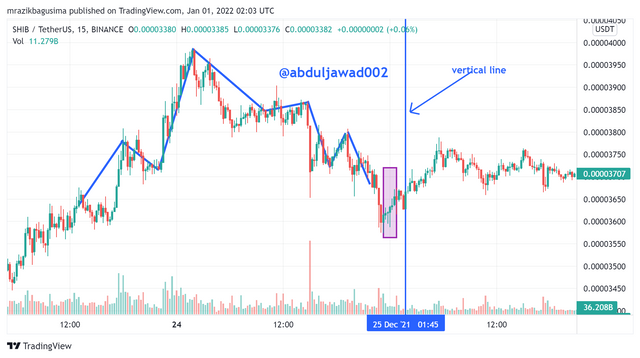
3. Finding a break in the price and the engulfing candle pattern. The price is represented by the bullish and bearish candlesticks and the engulfing candle pattern is a point in the chart where the bullish and the bearish candlestick breaks even and continue its movement in the opposite direction to its previous movement. So after the step 2, we patiently wait for the price to break. And in this scenario because my previous movement was a bullish trend my break will be a bearish engulfing candle pattern. We then search for a bearish candle which covers a bullish candlestick fully or vice versa and that point will be our break. We also have to mark the enveloping candle(the break candle) with a horizontal and vertical line to identify our candle.
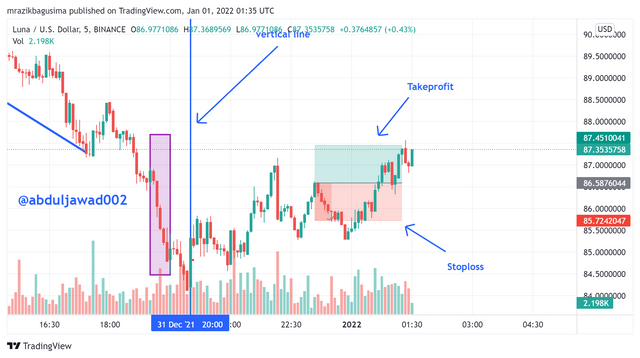
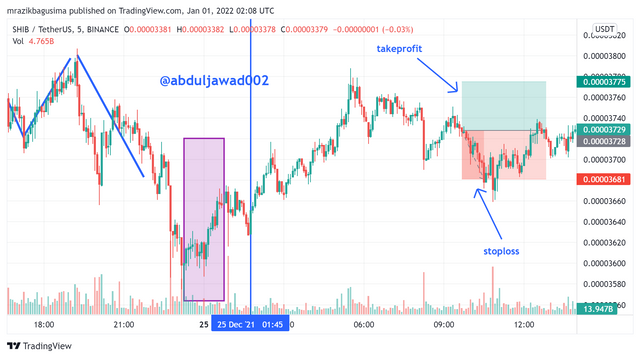
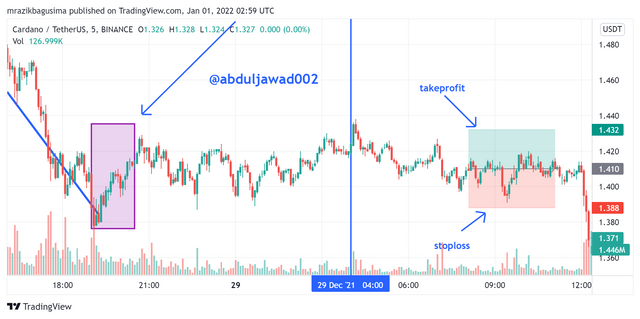
4. Changing the timeframe to 5 minutes to look out entry. We need to change the timeframe from the previous (15 minutes) to current (5minutes) and look for the marked point(engulfing candle ) we created in our previous step. Once we change the timeframe to 5 minutes the zone will be already broken, which means that we will have to wait for the price to return to the zone again, and when a bullish candle shows we then make our entry into the market. The stoploss will be below the last retracement and the takeprofit will be at the above the resistance level.
First step
Second step
Third step
Last step
Q2. Explain in your own words the interpretation that should be given to a large strong movement in the market. What does the price tell us when it happens?

In situations where there is a large strong movement in the market it is considered as a bullish trend where the is an upward movement of higher highs and higher lows. When it happens so, we tend to realize that the trend cannot keep moving up which means there is going to be a downward change in the movement in the market known as a bearish trend.
This change in trend is cause the the whales. Whales are huge cryptocurrency investors they usually or specifically intervene in the movement of the prices of the crypto assets when the trends happens to start to contradict them. They basically have the power influence the movement of crypto currencies. These investors own a huge number of lots and these lots make it loss to manipulate the trends of the market to your trend of your choice. All the whales have to do is open the lots towards the direction the wants and the trend tends to follow those directions.
Q3. Explain the trade entry and exit criteria for the buy and sell positions of the trading strategy with Price Action and Engulfing Candlestick Pattern in any cryptocurrency of your choice (Share your own screenshots taking into account a good ratio of risk and benefit)?

In the trade entry and exit criteria for buy and sell positions with the trading strategy of the price action and engulfing candle pattern, it should be established that you have to abide by the rule to stand a greater chance of having a successful trade.
1. First and furemost we have to establish a point on the trend where there is a strong movement in the chart either upward or downward. If it happens that such point have not been discovered in the specific timeframe yet, the n the strategy will not work accurately and the best option is to find a crypto cure which offers a more stable trends movement in the market.
2. Secondly we have to be notified on what type of trend is considered a strong trend. Not every trend of either bullish or bearish candle can be considered as a strong and valid trend. For a trend to be considered as valid and strong it has to encompass 3 or 4 force candle with a good body. The force candles are very helpful in determining the movement a trends seeks to take.
3. Thirdly and most importantly we must take very serious note about the enveloping candle which we will mark in the 15 minutes timeframe and once we change the time frame to 5 minutes we go and check whether the zone is broken or not. If the zone is broken we will then have to wait for the price to rise and give us a new setback and once the price starts to fall we will now be able to enter the market. But if the zone was not broken during the change of the timeframe we just have to look for a clear break in force to make a trade.
4. Finally, when the zone of the 15 minute engulfing candle breaks due to the change in timeframe to 5 minutes our stoploss will be below the bearish candle which marks our entry into the market. The takeprofit will also be at the last resistance. Most importantly we have to make sure that the risk to reward ratio is 1:2.
Q4. Make 2 entries (One bullish and one bearish), using the “Price Action and Engulfing Candlestick Pattern” trading strategy. These entries must be made in a demo account, keep in mind that it is not enough to just place the images of the execution, you must place additional images to observe the development of these operations to be able to be correctly evaluated and see if they really understood the strategy.

Buy Entry
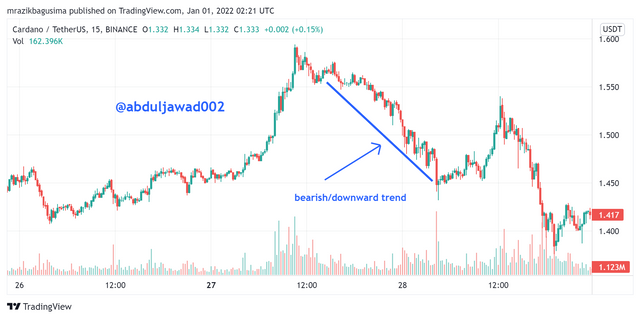
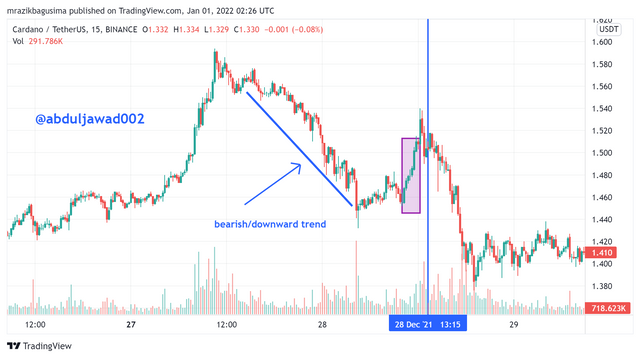
Below is a screenshot of the pair ADAUSD showing a series of lower lows and lower highs signifying a bearish trend and as seen in the charts more than 3 strong body bullish candle which implies that this chart is perfect for the strategy.
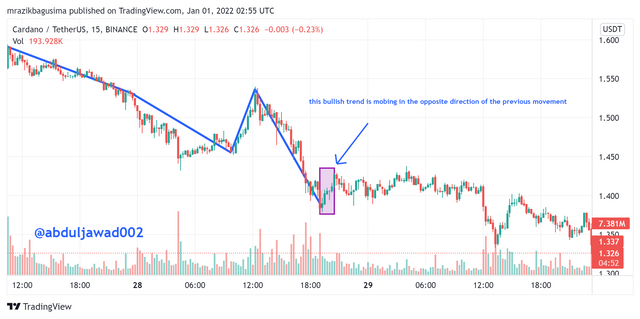
In this image, we can see that the trend is moving in the exact opposite direction to the previous movement which implies that the previous bullish trend is changing into a bearish trend. And this change in trend is caused by the whales, large investors and institutions.
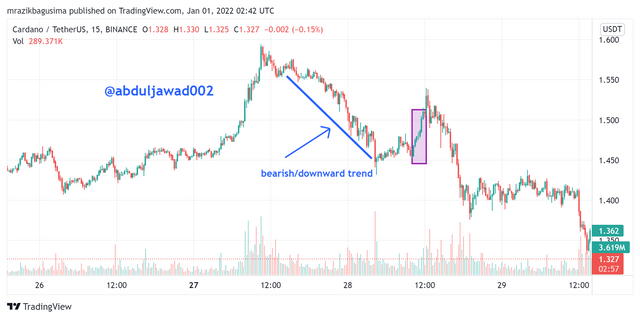
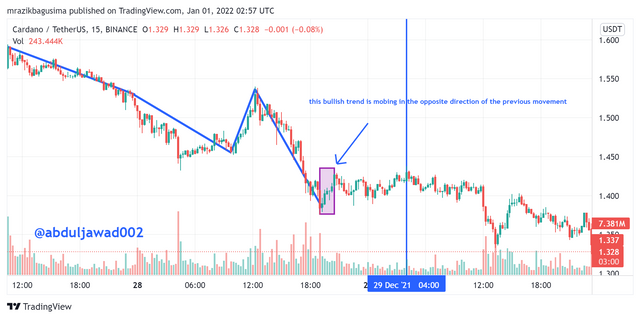
I now waited for the engulfing candle pattern where bearish candle fully covers the bullish candle and I made a horizontal line from both e the top and down of the bearish candle to mark it as we will need to locate it later.
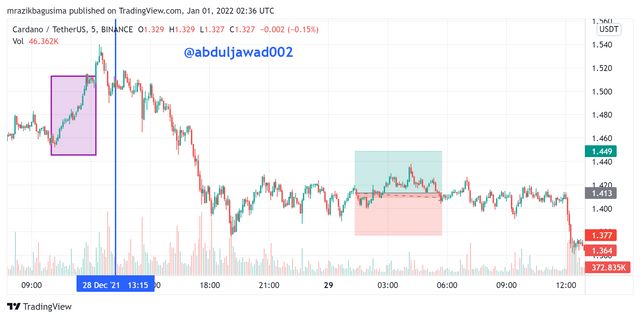
In this next chart I change the timeframe of the chart from 15 minutes to 5 minutes. When I did so, it causes the zone to break so I had to wait for the zone to come back for me to make a buy entry.
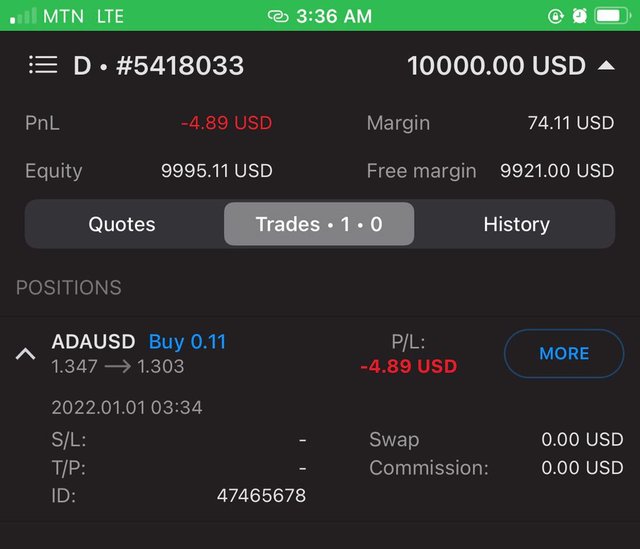
I then opened my MT4 app to receive the buy order as seen in the screenshot below the buy order running.
Sell Entry
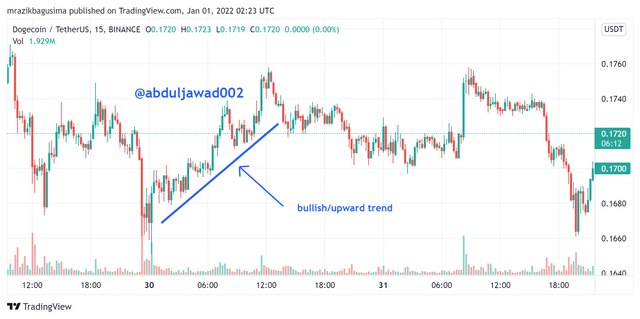
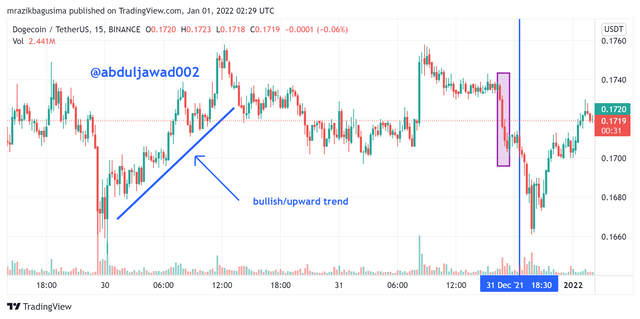
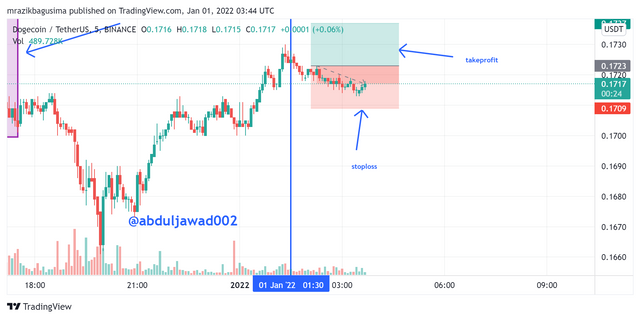
Below is a screenshot of the pair DOGEUSDT showing a series of lower lows and high lows signifying a bearish trend and as seen in the charts more than 3 strong body bullish candle which implies that this chart is perfect for the strategy and is within a 15 minute timeframe.
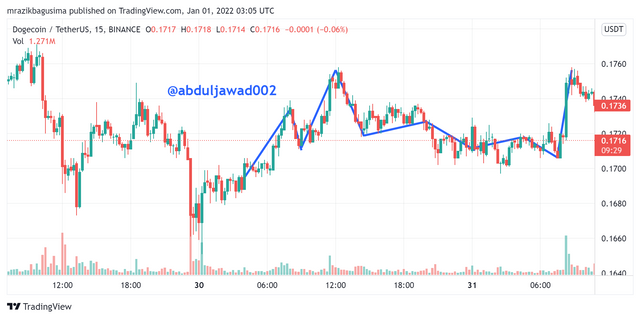
We can see that the trend is moving in the exact opposite direction to the previous movement which implies that the previous bearish trend is changing into a bullish trend. And this change in trend is caused by the whales, large investors and institutions.
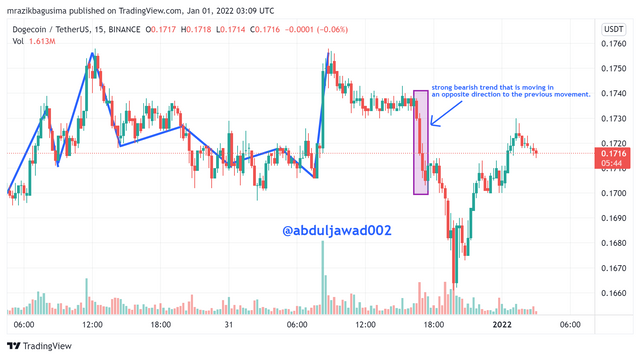
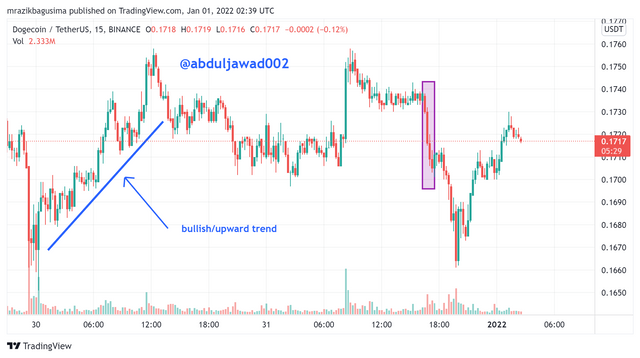
We then wait for the engulfing candle pattern where bullish candle fully covers the bearish candle and I made horizontal and vertical lines from both the top and down of the bullish candle to mark it as we will need to locate it later.
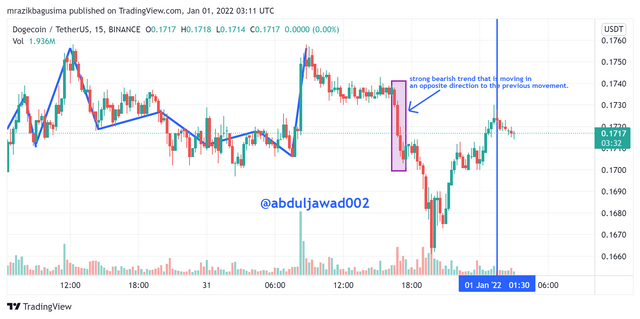
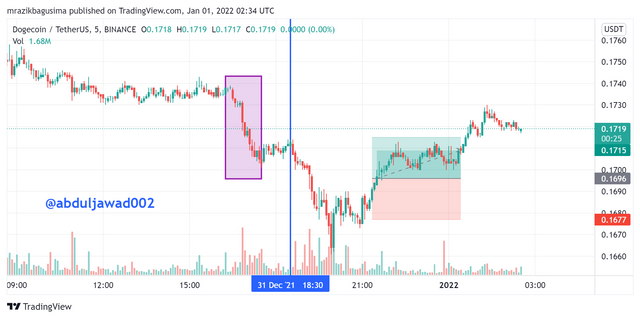
We now have to change the timeframe of the chart from 15 minutes to 5 minutes. When I did so, it caused the zone to break so I had to wait for the zone to come back for me to make a sell entry. The stop loss was placed slightly above the engulfing candle and take profit was set at last support.
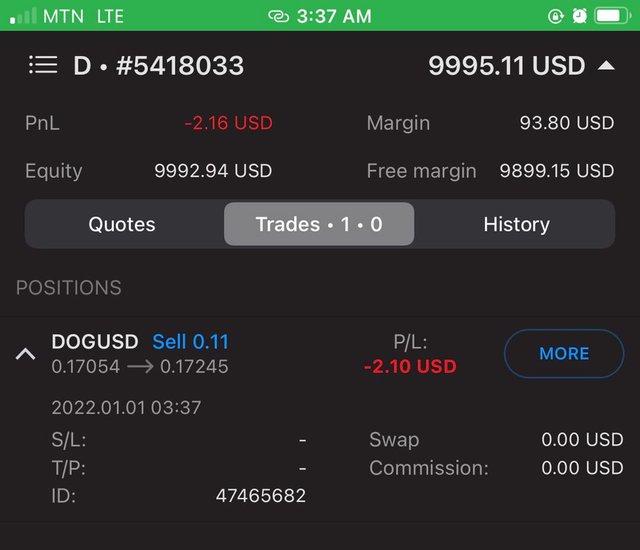
I then opened my MT4 app to receive the buy order as seen in the screenshot below clearly showing the sell order the pair DOGEUSDT we placed running.
ALL IMAGES IN THIS POST ARE SCREENSHOTS TAKEN FROM MY MT4 APP AND EDITTED ON MY DEVICE.

In conclusion, I would like to once again extend my regards to professor @lenonmc21 for this wonderful I really have enjoyed the lecture and hope to learn more insightful things from you.
Thank you.