Japanese Candlestick Patterns - Steemit Crypto Academy Season 5 - Homework Post for Task 10

Hello fellow steemians, today is another great day hope you are all doing well and goodmorning to professor @reminiscence01 , hope you having a good day.

1a) Explain the Japanese candlestick chart? (Original screenshot required).
b) In your own words, explain why the Japanese Candlestick chart is the most used in the financial market.
c) Describe a bullish and a bearish candle. Also, explain its anatomy. (Original screenshot required)
1a) Explain the Japanese candlestick chart? (Original screenshot required).
As many users are now getting into cryptocurrencies they need to understand how it works more specifically how to read the crypto charts to better understand trends and to better decide how and when to invest.
Japanese candlestick as in it's name originated from Japan in the 1700's by a man of the name Munehisa Homma. Munehisa Homma was a trader(rice trader) who upon studying and understanding how the market reacts to the prices(supply and demand) created the basis for the japanese candlestick to be formed. Japanese candlestick is now the most used chart in trading crypto assets as it helps indicate sentiments between buyers and sellers. The Japanese candlestick chart is basically a graphical representation of the price of a crypto asset from the interaction between buyers and sellers of that cryptocurrencies over time.
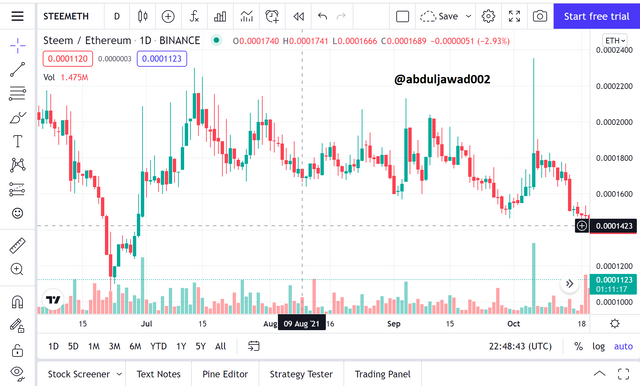
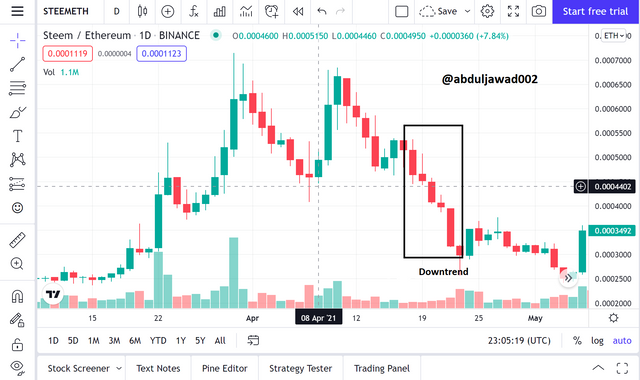
In the above image of the Japanese candlestick, we can see that there are two dominating candles in the charts with mainly red and green in color. The red color depicts an upward trend in the chart and the green color candle depicts a downward trend in the chart. A chart can either be bullish or bearish depending on the change in price. They are four price points in the Japanese candlestick which are the high price, the close price, the open price, and the low price.
b)In your own words, explain why the Japanese Candlestick chart is the most used in the financial market.
The Japanese candlestick charts are mostly used in the financial market because of their use in analyzing prices with technical traders. They offer more information visually from showing the market's highest price to the lowest price and from the opening price to the closing prices.
The Japanese candlestick provides clear and easy patterns that are highly accurate in predicting market trends. Using these patterns with a little bit of basic technical analyses, you can see the pattern emerging in the market which you can to your advantage.
The Japanese candlestick displays a unique bullish and bearish reversal pattern that can not be seen of any other chart. The appearance of a candlestick provides a lot of information about the state of the market is going.
Japanese candlestick also displays who is in control of the market over a period of time which can help a buyer asses bais over that time. It also makes it easy to study the code for the creation of new trading algorithms which use technical analysis.
c) Describe a bullish and a bearish candle. Also, explain its anatomy. (Original screenshot required)
Bullish Candlestick
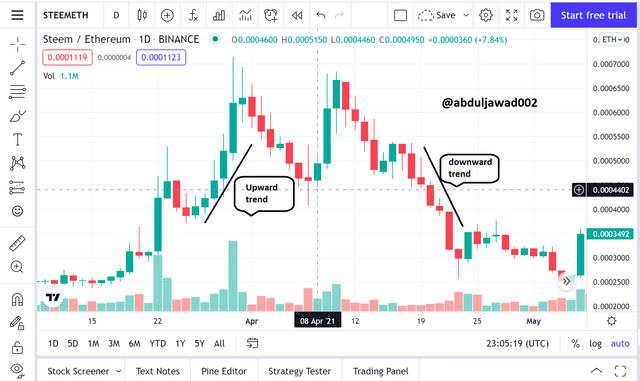
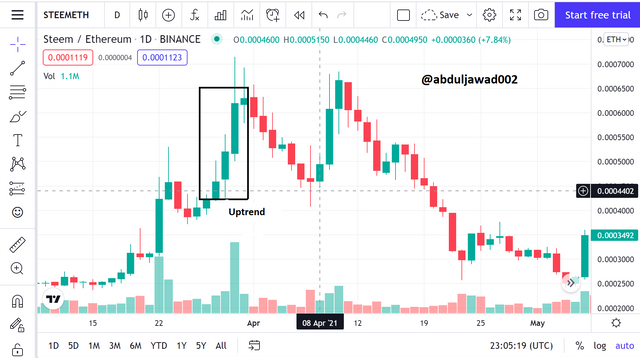
A bullish candlestick pattern informs people that the asset is rising. The color of the two candles can be changed to the user's choice. That is to say, it is not a constant color. Below is an image showing the uptrend of the bullish candlestick.
Bullish candlestick anatomy
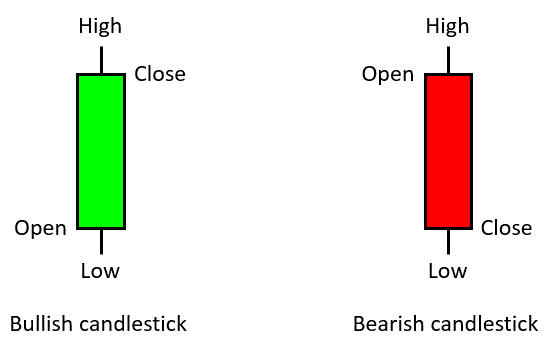
The bullish candlestick is known to show the upward increase in the price of an asset. As seen in the above images, it has been mainly identified to have four main parts to it. That is the high, low, open, and close. It is usually denoted by a green color.
High
This shows the highest price recorded over a specific period of time. The highest price may be confused with the closing price in cases where the candlestick has no upper shadow. In that case, the high price is the same as the close price.
Close
This shows the last price recorded in a candlestick and is right below the upper shadow. It is located at the end of the upper shadow.
Open
This shows the start of the movement of price. from this point is measured to determine how long the trend is going to be upward. It is located at the end of the lower shadow.
Low
This finally shows the lowest price recorded over a given period of time. And just like the high price, in cases where the low price has no lower shadow, then it is recorded the same as the open price.
Bearish Candlestick
Bearish candlestick patterns usually come right after an upward trend(bullish trend) to imply a decrease in the price of an asset. Below is an image showing the downward trend of the bearish candlestick.
Bearish candlestick anatomy
The bearish candlestick is the exact opposite of that of the bullish candlestick. It shows a downward trend implicating a decrease in the asset. It is usually denoted by a red color and just like the bullish candlestick, it is also composed of the same four main price points on the bullish candlestick.
High
This shows the highest price recorded over a period of time. In some cases where the bearish candlestick has no upper shadow, it is recorded the same as the open price.
Open
This shows the start of the decrease in the price of an asset recorded over a period of time. It is located at the end of the upper shadow.
Low
This shows the lowest downward price recorded over a period of time. And just like the high price, in some cases where there is no lower shadow, the low price is recorded the same as the open price.
Close
This shows the last of the decrease in the price of an asset recorded over a period of time. It is located at the end of the lower shadow.
NOTE ALL IMAGES USED IN THIS POST ARE SCREENSHOTS FROM MY DEVICE.
In conclusion, my regards to professor @reminiscence01 once again for this wonderful task I really learned something really useful and I hope to use it in the best way possible.
Thank you.