BTCUSDT Price Analysis

CoinTelegraph :
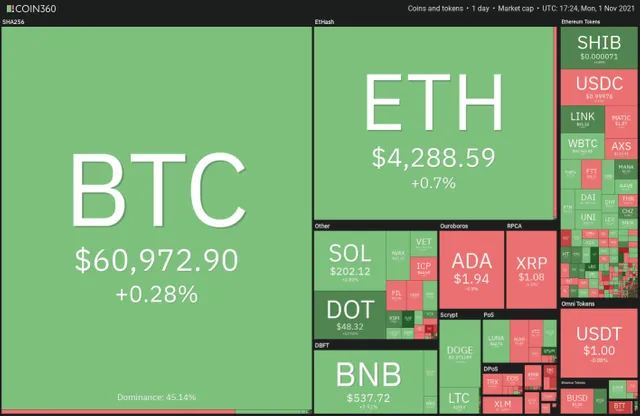
Bitcoin (BTC) and Ether (ETH) had their highest monthly close ever in October, indicating strong momentum that favors buyers. The focus now shifts to November, which has been largely bullish for Bitcoin.
Since 2013, Bitcoin has closed November in the red on only two occasions, in 2018 and 2019. Another positive impetus for Bitcoin could be the tailwinds from the United States stock markets, which also have an enviable record in November.
The S&P 500 has recorded a median rise of 2% in November, the only month of the year to achieve such impressive median returns.
Data from Glassnode also shows that Bitcoin reserves on exchanges are at their lowest level in three years. The amount of Bitcoin held on the books of exchanges has dropped from 3.1 million Bitcoin in April 2020 to 2.47 million BTC. According to analysts, this could be bullish for Bitcoin if the demand shoots up because that could create a supply shock.
Could Ether lead the altcoins higher or will Bitcoin remain in the driver’s seat? Let’s analyze the charts of the top 10 cryptocurrencies to find out.
BTC/USDT
Bitcoin turned down from the resistance line of the flag pattern on Oct. 31 but the bulls did not allow the price to sustain below the 20-day exponential moving average (EMA) ($59,876). This is a positive sign as it shows that traders are buying on dips.
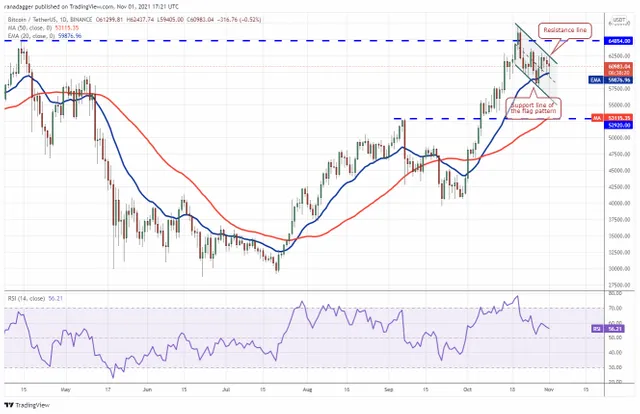
A break and close above the resistance line will complete the bullish flag setup. The BTC/USDT pair could then rally to the all-time high at $67,000. This level is likely to act as a major roadblock but if bulls can overcome it, the pair could start its journey toward the target objective at $89,476.12.
The rising moving averages and the relative strength index (RSI) in the positive zone indicate that bulls have the upper hand. The first sign of weakness will be a break and close below the 20-day EMA. Such a move could result in a decline to the support line of the pattern.
The selling could accelerate if bears sustain the price below the flag. The pair could then drop to the 50-day simple moving average (SMA) ($53,115).
Source : https://cointelegraph.com/news/price-analysis-11-1-btc-eth-bnb-ada-sol-xrp-dot-shib-doge-luna