Historic April Blizzards Following the Grand Solar Minimum Timeline to 2022
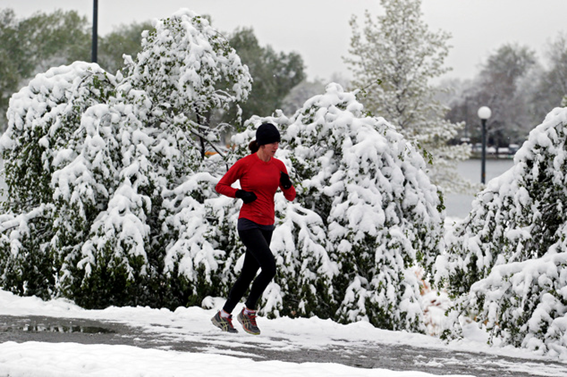
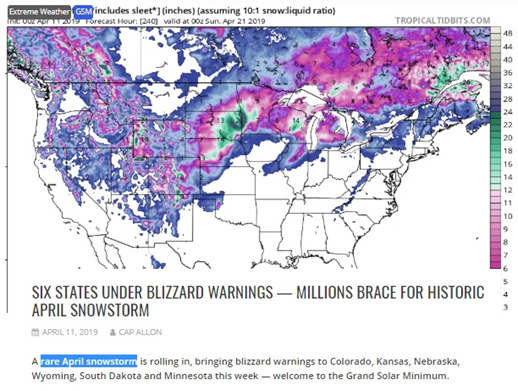
Here it goes again; historic and rare snowstorms! How many times have we heard this throughout the winter of 2018–2019? This same event was experienced in the winter of 2017–2018 as well, but it was not as pronounced, whereas today, this seems to be in every single headline. In the map, green represents deep snow accumulations.
NOAA forecast, blizzards, severe storms, flooding, rare snows, fire danger, record heat and wind advisory are all on tap and moving eastward.
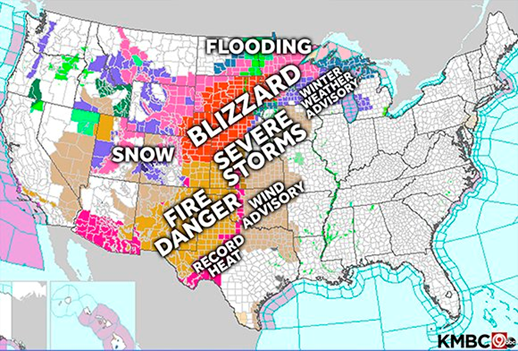
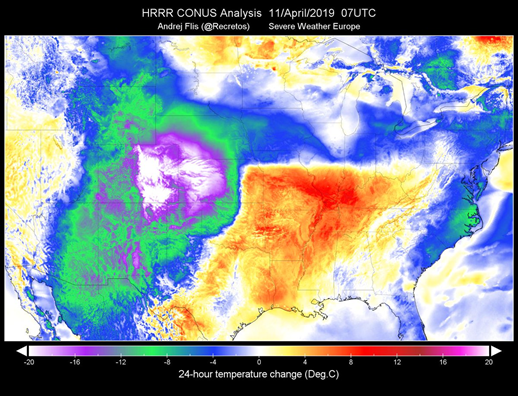
This previous map from NOAA looks a little sloppy though, so let us look at something else showing these very same events. The map below illustrates a 24-hour temperature change. The different colorations show where the most intense weather and the leading fronts of these colliding temperatures and air masses are going to be.
The reds represent warmer temperature, while the greens, blues and purples are cooler. The line of collision that is clearly defined on the map is where these extreme storms, winds, hails and just bizarre weather is going to be experienced. That purple shows the most extreme temperature drops, which by the way are in degrees Celsius. About 25 to 30 degrees Fahrenheit in some of these purple areas. Also, that white and purple shows a huge drop in temperature in a single 24-hour period.
Temperature differences can also be seen in a 2-meter ground temperature map as shown below. Obviously, reds are warmer, while blues and blacks are cooler. Those blue, black and teal areas of the map are already at the freezing mark. Black specifically is at 10 or more degrees Celsius below zero, around mid-teens Fahrenheit, maybe pushing into the 20s. Again, this gives you a good indication about where the most severe weather is going to be bunching up, as this system moves eastward.
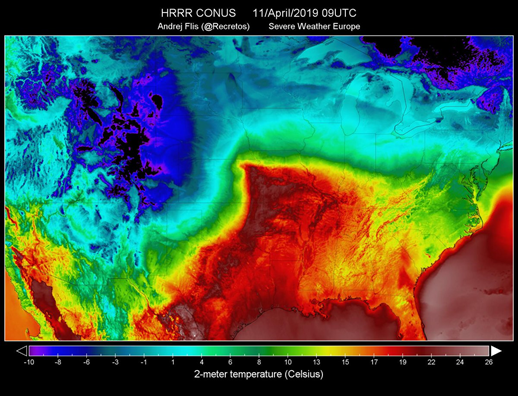
This map shows a pocket that is broken off and is heading up toward the Great Lakes accompanied by an extreme temperature anomaly. That itself is going to cause bizarre weather, but the lines are discernable, and these will become more and more intense as we move through this Grand Solar Minimum with magnetic pole excursions.
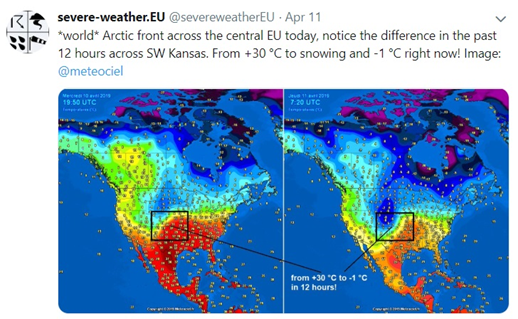
I thought of looking at what the temperature inversion was, since they had been talking about this in Kansas. When I did, it was blocked. This is where it is going now with this internet censorship: blocking of weather reports!
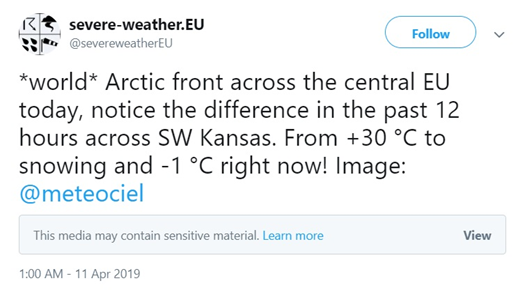
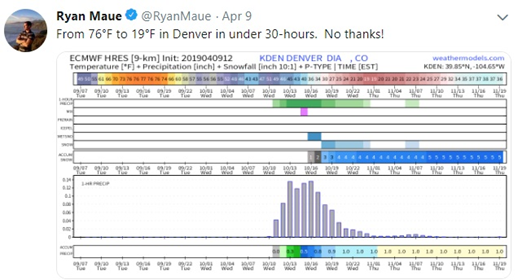
After I adjusted the settings in my Twitter account, I found out the image that they are trying to hide from you and me. The +30 degrees Celsius temperature swing in 24 hours. 30 degrees Celsius in Fahrenheit is 86. Anyhow, this dropped to 31 degrees Celsius with snow. So, from 86 degrees Fahrenheit down to freezing temperatures, which is a huge swing.
Similarly, just a couple of days ago, Denver had a temperature of 76 degrees Fahrenheit down to 19 in 30 hours, also a huge swing. What does this mean to anything that has budded early, or anything that has already sprouted in the fields? How do you think these plants are going to react to these types of temperature swings?
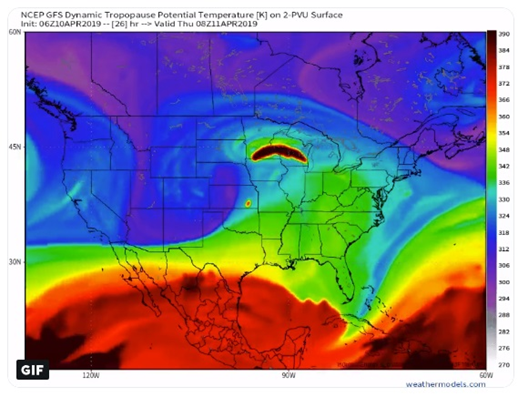
Let us also have a deeper look at the water column in the atmosphere. As you can see, from the gulf up in Mississippi through Middle Tennessee, extreme rivers from the sky are going to dump there. Notice also where that line is crunching together. That was shown earlier in the temperature maps and every time you see this type of anomaly, please take them seriously, along with the weather warnings NWS puts out.
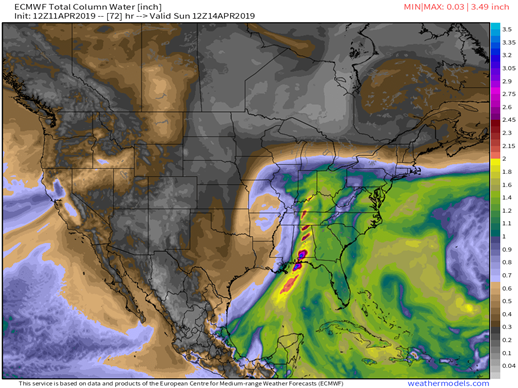
This type of atmospheric compression and movement of the jet streams have not been seen in hundreds of years, and now it is back again.
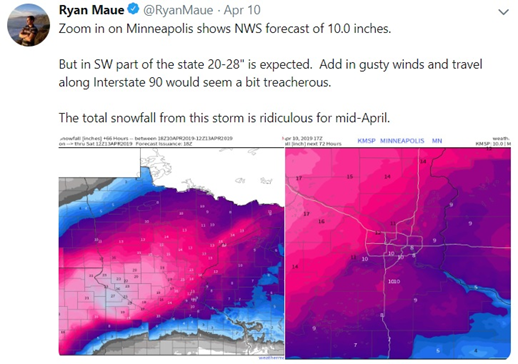
And as this event make its way eastward, blizzard conditions will be experienced in so many places through the next couple of days, 28 inches of snow is expected throughout Minneapolis, as this system passes toward the Great Lakes.
With regards to the suppression in the media about information opposite of the global warming narrative, things are not just coming to fruition because a complete opposite of what the IPCC said is now happening. But instead of accepting their mistake and try looking closely at the science of it, they chose to bury it off the internet. For instance, Twitter is doing its very best to suppress weather information! Every single entry is tagged as “sensitive material”.
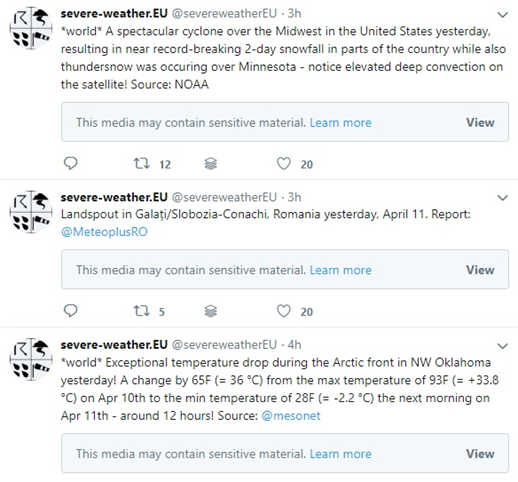
So, I went around the sensors and visited severe-weather.EU.com website. This is what in the sensitive material: mix-ups in the jet stream, which means hot, cold, hot, cold for Europe. I guess this is too inconvenient.
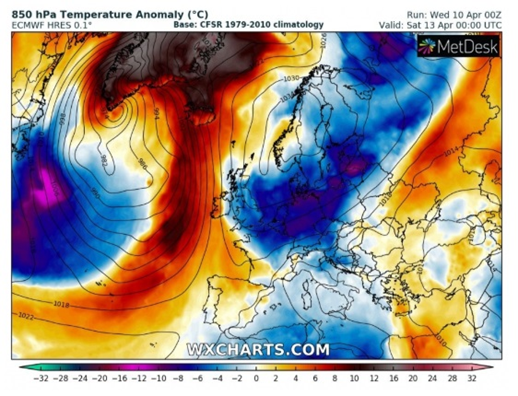
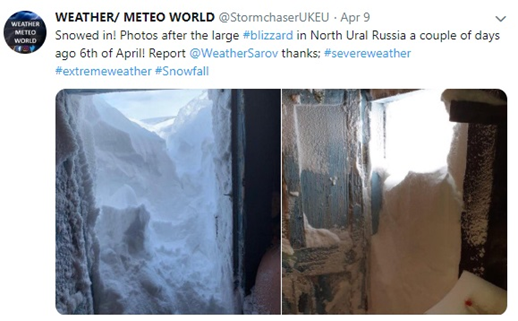
Look at the blizzard that swept through the Ural Mountains leaving several feet of snow this late in April. Russian media is also calling this unprecedented and rare April snow. So, what are the chances that Europe, Russia, United States, Canada, Japan, Pakistan, and so many other places across our planet are receiving rare and unprecedented April snows?
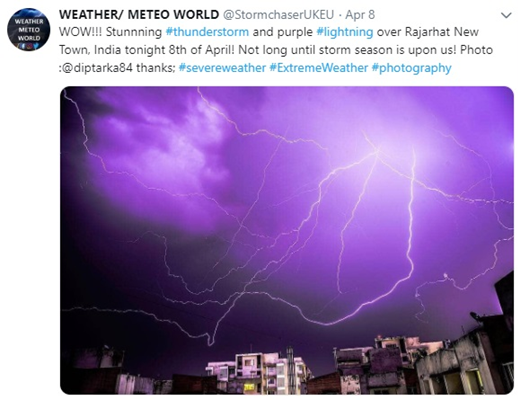
Additionally, Electrical ferocity is also observed in India. The sky is crisscrossed with lightning also known as visible plasma discharges, spectacular.
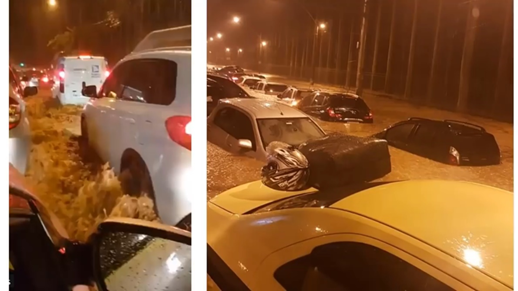
In Rio, finally some decent photos of the extent of the flooding can now be seen. This event was coupled with other problems as well; crocodiles were out in the waterways after they escaped from the zoo. There were shootings in the favelas, where gang members were shooting at the police and army as rescue teams were trying to get in there. It was ridiculous, but this is how much flooding going on there.

During this event, there was a lot of spotty coverage coming out. Again, good videos regarding this were from social media, not from mainstream news. The corporate media kept regurgitating the same one or two video clips. So, you really must dive into social media to get a good rundown on what is happening. I have written every story links at the end of the article for your perusal. But, “unprecedented”, is what the Brazilian media is calling this.
I do not know how many times you can call something unprecedented before you start asking questions. Corporate media is dropping the ball right now; these are clearly not CO2 related issues. There is something else going on. Why are they not asking questions about this? Why are they not looking into the cycles in the past?
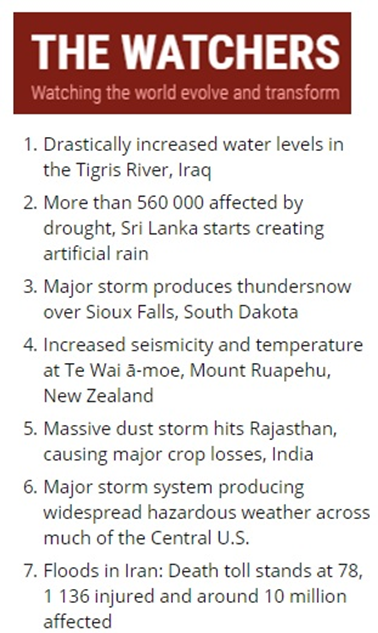
When I jumped over to The Watchers, there is so much going on. I cannot even write this into a single article because this will be too long, but I can do a Cliff note version for you.
Drastically increased water in the Tigris River; Massive droughts in Sri Lanka, which was also seen in the 1600s; Thundersnow accompanying the front, which I just discussed; Massive dust storms in Rajasthan, and in Iran again with unprecedented and record floods. Iran’s records go far, far back to the trading days on the Silk Road with the Arab traders, yet they are calling this unprecedented flooding. Something has definitely changed.
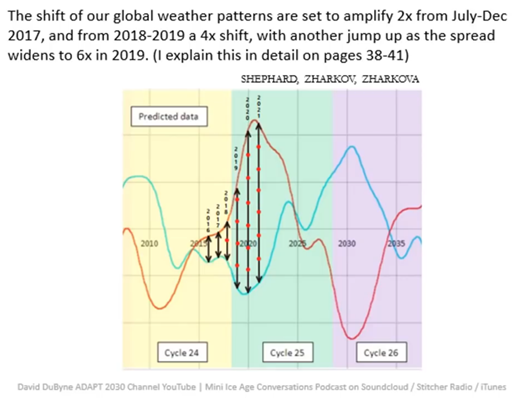
These events, however, are keeping in lockstep with what the astrophysicists have predicted in the intensification timeline for the Grand Solar Minimum. This is off Valentina Zharkova, Shepherd, Popova and Zharkov’s Double Dynamo in the Sun. I put the lines in there year by year, so you can easily see where the step-up is.
We are at the very end of a solar cycle 24 and we are moving right to solar cycle 25, the green area. The crests and the troughs in the graph represent the magnetic instability and canceling waves in the Sun. The wider these waves are, the more magnetic canceling effect happens on the Sun, which affects the Earth’s jet streams as the magnetosphere weakens further due to a magnetic pole reversal underway.
After we enter that green area, the beginning of solar cycle 25, look at how
wide it spreads, this is shown by the length of the arrows. The wider the spread, the more instability there is in the weather. This is on track to what we are currently seeing with these massive up ticks in the weather. But those are nothing compared to what are going to come in 2020 to 2022 and this is obvious with the full deflection campaign going on in the corporate media, to keep everybody in the dark about these changes.
You are absolutely on your own. I will leave links to every single article or video that I do so you can chase down your own resources. Because your survival is going to be up to you, to inform yourself about what is going on, so that you can keep yourself and your families safe. I encourage you to do the most research you can. Please take note, the Earth is speaking to you with these swings in the weather systems that are so unusual.
Thanks for reading, I hope you got something out of the article. If you like more information like this I produce the tri-weekly Mini Ice Age Conversations podcast, 30 minutes of in-depth analysis on the GSM you can take on the go.
Mini Ice Age Conversations Podcast
iTunes: https://itunes.apple.com/us/podcast/adapt2030
Soundcloud https://soundcloud.com/adapt-2030
Libsyn http://adapt2030.libsyn.com/
(MIAC #200) America’s Damaged Agriculture 2019: Look for Doubling Food Prices
For the bi-weekly Grand Solar Minimum climate update newsletter from myself, David DuByne, (ADAPT 2030) jump over to oilseedcrops.org you can enter your email and sign up. Move your mouse around for about 10 seconds and this box will pop up.
Join ADAPT 2030 NEWSLETTER http://www.oilseedcrops.org
“Help support the adapt 2030 channel on brighteon so we can keep Grand Solar Minimum information free to access.”
https://www.brighteon.com/channel/adapt2030
Support ADAPT 2030 by Visiting Our Sponsors
ADAPT 2030 & My Patriot Supply 2-Week Food Supply with 92 servings
www.preparewithadapt2030.com
True Leaf Market Heirloom Seeds ADAPT 2030 True Leaf Market Link
ADAPT 2030 Amazon Grand Solar Minimum Book Store https://www.amazon.com/shop/adapt2030
Upheaval: Why Catastrophic Earthquakes Will Soon Strike the United States https://amzn.to/2E7KbBt
*** Today’s Story Links ***
HRRR Con US Temperature Drop 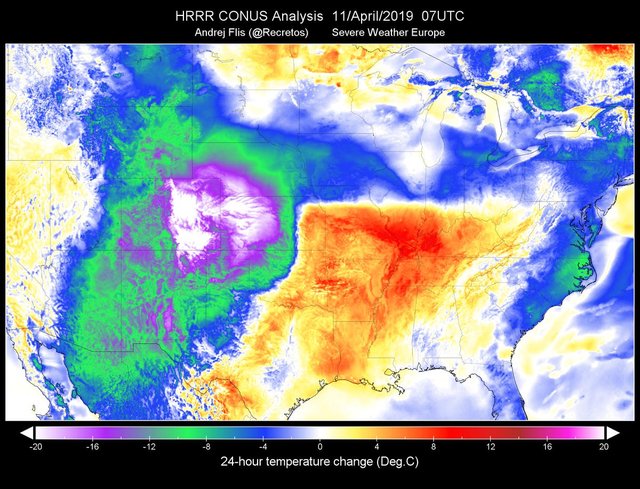
2meter ground temperatures 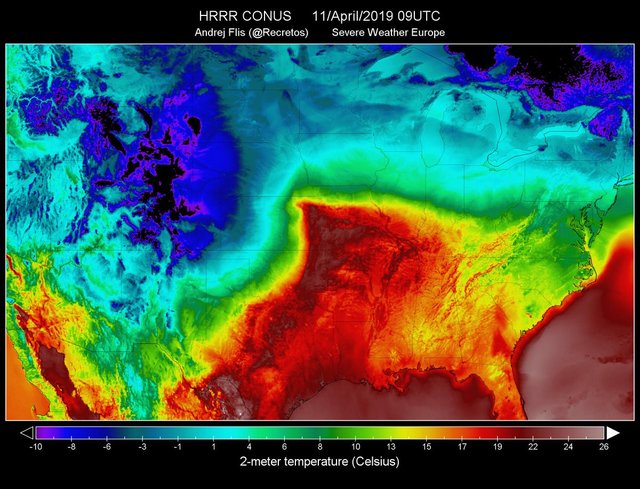
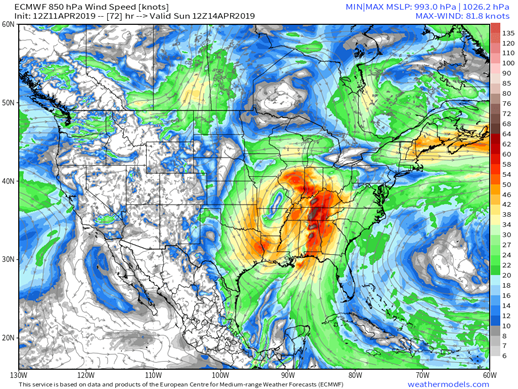
US wind speed maps 
Water column map USA 

USA hazard map 
Major storm system producing widespread hazardous weather across much of the Central U.S. https://watchers.news/2019/04/11/major-storm-system-producing-widespread-hazardous-weather-across-much-of-the-central-us/
Blizzard warning USA https://electroverse.net/six-states-under-blizzard-warnings-millions-brace-for-historic-april-snowstorm/
Rio Floods 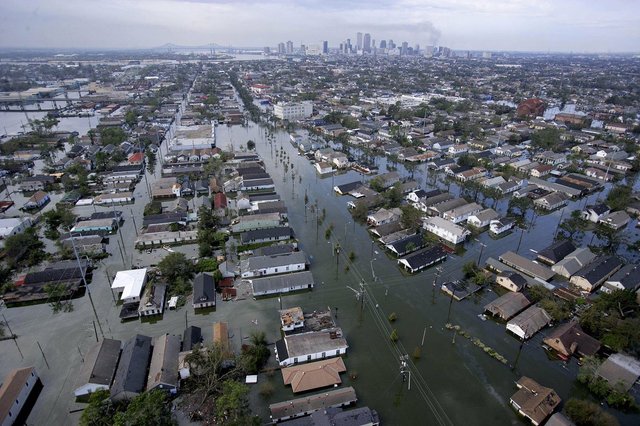
*** ADAPT 2030 Social Media Links ***
PATREON https://www.patreon.com/adapt2030
YOUTUBE ADAPT 2030 Mini Ice Age 2015–2035 Series on YouTube
BITCHUTE https://www.bitchute.com/hashtag/adapt2030/
BRIGHTEON https://www.brighteon.com/channel/adapt2030
STEEM https://steemit.com/@adapt2030
MINDS https://minds.com/ADAPT2030
MEDIUM https://medium.com/@globalcooling
FB https://www.facebook.com/Miniiceage
TWITTER https://twitter.com/adapt2030