More Commitment of Traders Perspective
We all saw a lot of commentary and "analysis" over the weekend regarding the latest Commitment of Traders report. Again, these numbers are most important when considered through the lens of historical perspective and that's what we attempt to show you today.
It's going to be a long and busy week. From Fedlines to Durable Goods to GDP...there's a lot going on. And Lord knows what lies ahead politically and geo-politically!
The metals have begun the week just slightly to the upside and this is nice. More on this later today and as we go through the week, of course.
However, for today I'd like to simply concentrate on the two charts below. Again, the only real value in analyzing the CoT reports is in being able to reference the current positioning versus historical data and price. For me, the best way to do this is to simply lay some data onto a weekly price chart.
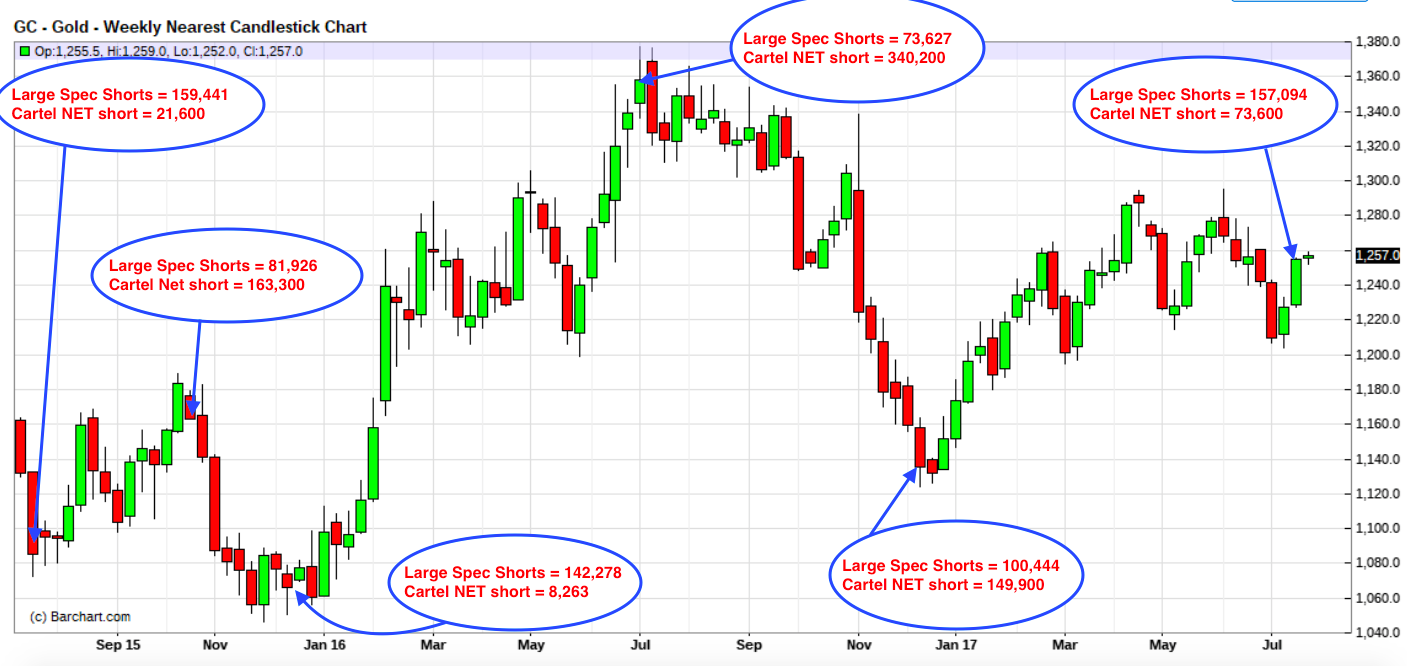
Let's start with Comex Digital Gold. If you listened to last Friday's podcast, then you know that:
At 157,094 contracts, the Large Spec GROSS short position is the largest seen since the survey taken July 28, 2015
At 153,064 contracts, the Gold Commercial GROSS long position is the largest since December 1, 2015
At 73,635 contracts, the Gold Commercial NET short position is the smallest since January 26, 2016
But how does this all appear on the chart? Are these levels historically significant? Please take the time to expand (and perhaps print) this chart. Take a good, long look and decide for yourself.
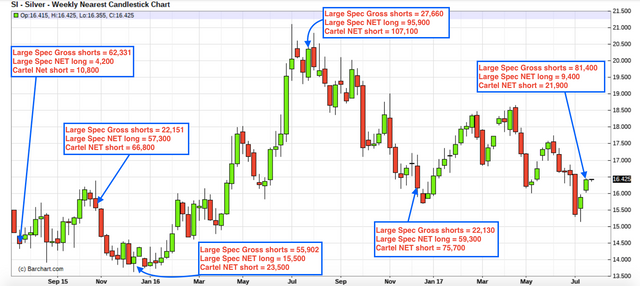
Now that's all very interesting. However, where the historical perspective really jumps out at you is when you consider the chart/data combo for Comex Digital Silver. Again, as of the report released last Friday and surveyed last Tuesday:
At 81,400 contracts, the Large Spec GROSS short position is the largest ever reported. In fact, the size of this position is now 27% greater than the previous all-time high of 63,993 seen on July 7, 2015
At 66,398 contracts, the Silver Commercial GROSS long position is the largest since August 25, 2015
At 88,312 contracts, the Silver Commercial GROSS short position is the smallest seen since January 19, 2016
At 21,914 contracts, the Silver Commercial NET short position is the smallest since September 15, 2015
As in CDG, if we plot some data and price together, the result looks like this. Again, please take some time to give this chart your full consideration.
So what does this mean? Well it certainly appears that chances are high we see some significant rallies from here. As important technical indicators such as moving averages get bullishly crossed, these massive Large Spec short positions are ripe for a squeeze. Shorts get covered (that's one buy) and then a long may be established, too (that's a second buy). All of this buying pressure will drive prices higher in the weeks ahead and this coincidentally falls right into line with our forecast of a failing 2017 narrative (GAN2017) and 2017 metal price highs in Q4.
Have a great day!
TF
www.tfmetalsreport.com/subscribe
Hey Turd, great to see your work here on Steem.
Congratulations @tfmetals! You have completed some achievement on Steemit and have been rewarded with new badge(s) :
Click on any badge to view your own Board of Honor on SteemitBoard.
For more information about SteemitBoard, click here
If you no longer want to receive notifications, reply to this comment with the word
STOPI hope to see 20 dollar silver ny december
WELCOME TO STEEM! Love all your writings :)
A very nice analysis. It's hard to argue with your reasoning. I'm in total agreement with your assessment. Thank you for sharing.
hello Turd, welcome to Steem, cheers soundmoney (subscriber to the Vault!)
Turd Ferguson joins Steemit!! This is awesome! Im a member!!!