Assessing desertification on a global scale with cloud computing
I have been working on this paper for almost half a year now, and next week I will defend it in front of a jury. So this is an ideal chance to get it read by others, if you have some remarks or questions about this post, make sure to let me know! I will try to summarize most parts because otherwise it will become a long and cumbersome read. I also filtered out the more technical aspects and codes out of the text. If you are dying to know how everything was calculated, let me know ;).
Introduction
Desertification is currently a serious environmental issue as drylands, i.e., the area prone to land degradation and desertification, makes up 40% of the earth’s land surface. This land is inhabited by approximately 1 billion people whose livelihood depends on the bio productivity of the environment (Paruelo, Oesterheld, & Vero, 2006). The phenomenon is already known since the 18th century but caught a lot of attention since the extreme Sahelian droughts in the late 1960’s and early 1970’s. Desertification is a broad term which definition went through many revisions.
When looking at these past definitions it can be seen that the origins and drivers for desertification have been debated for decades, especially the contribution of human activities compared to natural drivers. The correct definition on how drivers influence desertification however, is crucial for effectively mitigating and acting in affected regions and assessing long term changes with a consistent methodology. Despite the importance of a good understanding in the contribution of various drivers, the lack of a clear definition causes many diverging results on desertification assessment and mitigation (Vogt et al., 2011).
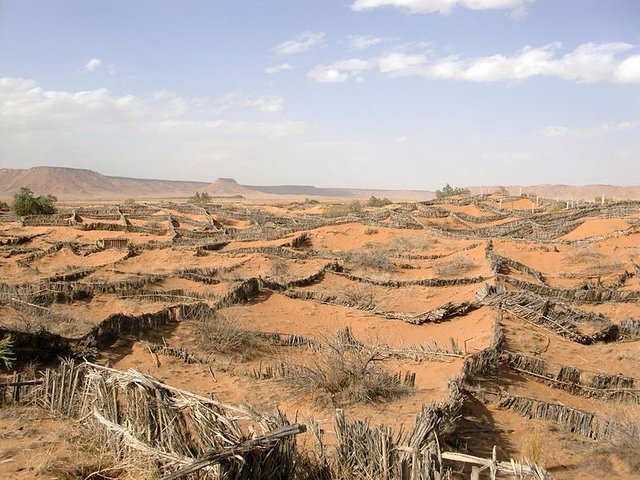
Attempted mitigation against desertification. Fences are placed to reduce erosion and capture run-off water. This image is licensed under the Creative Commons Attribution-Share Alike 3.0 Unported license by Anderson Sady.
Given the potential danger of uncontrolled desertification and the global recognition of desertification as a significant thread, it is surprising how little has been agreed on universal methods of assessing desertification through land degradation (Paruelo et al., 2006).
Recently, the availability of remote sensing imagery on a global scale allows to broaden the geographical scope of these studies and to homogenize the methods. However, in such continental or global studies, accessibility and storage managing of spatial data can become an issue. The need for computation power to process this data can furthermore cause limitations on flexibility with the data (Carr, 2009).
Due to recent developments in cloud computing technology such as the Google Earth Engine, a framework is provided for tackling these problems. With the Google Earth Engine it is possible to access free global satellite data from a wide time range that can be treated and analyzed on Google’s specialized servers, solving both the issue of data management and lacking computing power (Gorelick et al., 2017).
This paper aims to introduce the new technology and to test its capability of providing a large-scaled comparable analysis on the topic of desertification. The focus lies specifically on trends in desertification.;
Methods and data
The definition of desertification that will be used is the most recent UNCCD definition, stating that desertification is: “land degradation in arid, semiarid and dry sub-humid areas resulting from various factors, including climate variations and human activities.” (UNCCD, 2014).
In order to asses trends in desertification, land degradation has to be made measurable. Vogt et al. (2011) already addresses the diversity of assessment methods and importance of a systematic, integrated and standardized approach built on robust scientific grounds. But since developing and working with such an integrated and standardized approach is a topic for a study itself, other proxies will have to be used for the extend of this research.
Considering that field measurements for land degradation proxies such as soil fertility, soil compaction or erosion rates are not known on global scales, other proxies have to be selected that can be sensed remotely in order to provide spatially comparable and continuous measurements.
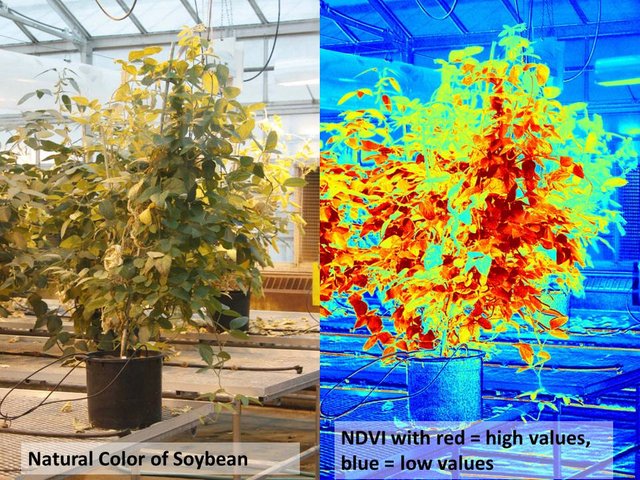
NDVI as an indication for vegetation productivity. High values indicate a lot of photosynthesis and thus higher Net Primary Producion. This image is licensed under the Creative Commons Attribution-Share Alike 2.0 Unported license by K-State Research and Extension.
NDVI has been proven to be a valuable asset in monitoring Net Primary Production (NPP) (Xu et al., 2012), which again can be linked to land degradation (Vogt et al., 2011). Despite NPP being criticized for not being directly correlated with land degradation and having ambiguous relations, this is what will be used because of the simplicity and accessibility of data.
In a second stage, NDVI evolution will be linked to dynamics in remotely sensed precipitation. This research does not claim to provide a comprehensive picture of desertification based solely on NDVI evolution. Rather, it aims to provide a framework for coupling proxy’s such as NDVI to other remotely sensed global data such as precipitation as to demonstrate the value of such an approach towards a better understanding of desertification and its drivers on the regional to global level.
The Google Earth Engine framework
The Google Earth Engine is the core technology that this papers tries to introduce. Computers have made tremendous changes in the recent years and computation power becomes more accessible each year. But available remotely sensed data is expanding even faster with a current archive of multiple petabytes. Unfortunately a lot of expertise is required to efficiently use these measurements, ranging from data management to machine allocations and data processing frameworks. This requirement of expertise often limits the use of these products to experienced researchers with accessibility to the required resources (Gorelick et al., 2017). I already wrote a post about this topic and if you are interested you can read more about it here:
So I will not go further into explaining this tool.
Defining the regions to be studied
Before commencing data gathering and calculations, well-defined regions need to be delineated on which the comparable analysis will be executed. Again, departing from the latest definition of desertification stated by the UNCCD, arid, semiarid and dry sub humid areas need to be looked at since these are by definition the areas where desertification can occur. The classification that will be used is based on de Köppen climate classification which comes close to the actual definition but only defines arid and semi-arid lands. This is clearly a limitation as the used regions do not fully match the actual definition of regions at risk.
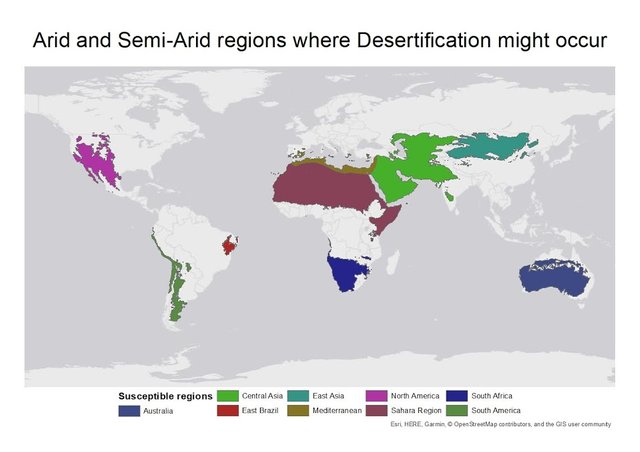
Since both arid and semi-arid lands can suffer land degradation, these two classifications were combined and used as a mask for further calculations. The mask gets subdivided into regions based on their geographical locations and the trends in these regions will be compared. The locations that were subdivided are Australia, Central Asia, East Brazil, the Gobi region, Mediterranean region, North America, Sahara region, South Africa and South America. They can be seen in the next figure.
NDVI as a proxy for land productivity and degradation
A commonly used index for evaluating land cover and productivity is the Normalized Difference Vegetation index or NDVI. It can be calculated from multi-band images which have been available since the late 20th century. The NDVI is calculated as follows:
NDVI=((NIR-RED))/((NIR+RED))
I have also written a post about this index already so I won't go further into the details, but you can read more about it here:
https://steemit.com/science/@samve/what-is-ndvi-and-why-it-is-an-indication-for-vegetation-cover
Precipitation to delineate natural variation
In order to link changes in land productivity (NDVI as proxy) with human interactions, natural drivers and variation need to filtered out. For analyzing climatic drivers on desertification, especially rainfall, again data offered by Google Earth Engine will be used. In this case, pre-processed data sources will be accessed such as PERSIANN (Precipitation Estimation from Remotely Sensed Information using Artificial Neural Networks). This is an algorithm that uses Infrared Imagery from geosynchronous satellites, combined with an adaptive training algorithm, or neural network, to estimate the total amount of precipitation for a given area and time (Ashouri et al., 2015). Natural fluctuations in precipitation and temperature can induce trends of desertification or greening and have already been used to explain greening trends in the Sahel (Higginbottom & Symeonakis, 2014; Yengoh, Dent, Olsson, Tengberg, & Tucker III, 2015). Whether these trends in precipitation are natural or induced by human activity is to be questioned as well.
Not only the amount of precipitation has expected influences on the land productivity. Extremities in rain intensities and dry spells might also determine the amount of vegetation growth. Therefor another proxy will be introduced to measure extremities, being the amount of consecutive dry days.
Global trends in desertification:
In this section, the dynamics in NDVI are discussed for the noteworthy focus areas delineated through the classification explained in the methodological section. For each significant region general observations on NDVI are made and their potential linkages to precipitation and number of dry days are discussed. Wherever relevant, literature is used to back statements and identify other potential factors contributing to NDVI evolution.
Note that due to a change in sensor from Landsat 7 to Landsat 8, calculated NDVI values based on both sensors are provided for completeness in all figures below. This allows the reader to discriminate true measured NDVI changes compared to shifts in NDVI values potentially occurring as an artifact of a changing sensor in the last Landsat generation.
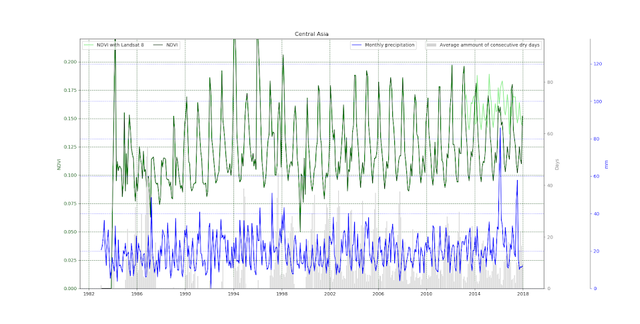
East Asia
As a first observation, the graph shows a visible link between precipitation and NDVI. This well-established correlation is confirmed by the many peaks in NDVI that follow a significant peak in precipitation. The years 1990, 1993, 1999, 2001 and 2012 for example experienced extremities in precipitation which were followed by extremities in NDVI that same season.
Secondly, the amount of consecutive dry days correlates with precipitation. During dry periods, many regions experience consecutive days without rain and the average of the entire region increases. As soon as the wet season approaches, the amount of consecutive dry days drops drastically since the majority of the pixels experience rain and the average amount of consecutive dry days resets. The number of dry days also appears to influence NDVI with in general a drop in NDVI when high numbers of consecutive dry days are reached. From 2014 onwards, no large peaks in number of dry days arise, while NDVI peaks consistently increases compared to the decade before. Whether this phenomenon actually takes place is debatable since a similar trend is also seen in the Sahara region and the values for the amount of consecutive dry days contains other abnormalities as well. Although this observation only covers a small period of time, especially regarding relevant climatic timescales, it does provide some insight in (1) the potential use of GEE computing for long term evaluation and monitoring and (2) the potential influence of climatic extremes such as increased monthly precipitation and exceeded period of drought on the NDVI evolution.
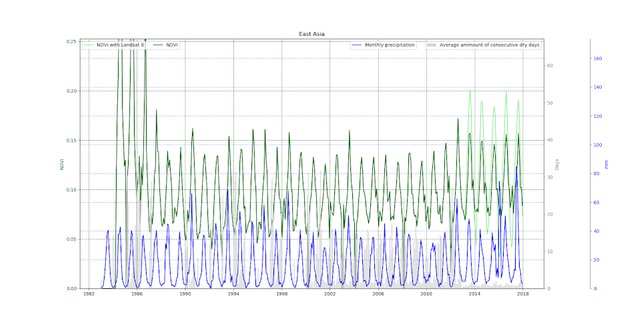
Drylands in Eastern Asia, and especially the Gobi desert has been repeatedly reported to expand and degrade. Symptoms are often exacerbated because research was undertaken with inadequate understanding of local factors (Sternberg, Rueff, & Middleton, 2015). A negative trend in land productivity cannot be seen and NDVI averages remain close to 0.1 until 2000. since then an upward trend can be seen which is also documented by Sternberg, Rueff, & Middleton, (2015). The average NDVI increases again from below 0.1 up to 0.12. These might seem insignificant changes, but due to the scale of the studied area, regional increases in land productivity get leveled out by the vast area.
Efforts of state controlled mitigation were made such as the “Grain for Green” program and the “Great Green Wall”. The concept of a Great Green Wall for halting the expending Gobi desert already arose in the 1970’s and is aimed to complete by 2050. It required every citizen older than 11 years old to plant at least three saplings every year to reinforce the desert boundary (Veste, Jiarong, Sun, & Siegmar-W., 2006). But despite the efforts the situation is only getting worse according to the Global Forest Resources Assessment (FAO, 2010).
The Grain for Green program has been active since 1999 and primarily aims to combat ecological degradation, overcultivation and soil erosion on the loess plateau of central China. Chinese governments already produced legislations to halt new cultivation on erosion-prone and fragile areas, but the new program aims to reforest farmlands back into ecological forests. Participating households would receive subsidies depending of the new use of their farmland. For converging farmland to ecological forest, landowners would get higher subsidies than when converging to economical forest of grassland. By the end of 2010 already 8.2 million hectares where afforested(Liu & Wu, 2010). This could have caused a positive effect on the NDVI since 1999, especially since the amount of cultivated farmland correlates with decreased NDVI according to Feng, Ma, Jiang, Wang, & Cao, (2015).
Australia
The arid lands in Australia again show a correlation between precipitation and NDVI. The years 1989, 1995, 2000 and 2011 show peaks in precipitation followed by an increased NDVI that season. Also do the amount of consecutive dry days appear to influence NDVI. 2003 was an exceptional dry year and this is both visible in the amount of dry days and the sharp decline in NDVI that followed only a few months later. Furthermore are the influences of other droughts clearly visible in these trends. One of the biggest droughts, the Millennium Drought started at the end of 1996 and worsened through consecutive dry years in 2002 and 2003 Conditions remained dry until eventually the La Niña emerged and quickly ended the drought by 2010 and 2011. For this region, this mostly translates in higher peaks in both precipitation and NDVI after 2010. Although again here, this effect can only be observed for a few years, it demonstrates the importance of overall climate patterns in NDVI peaks. (Bureau of Meteorology, 2015).
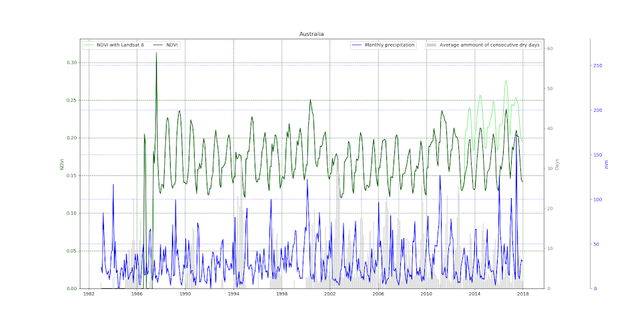
According to the latest IPCC report (2014) frequency of heat waves, and intensity of daily temperature extremes are very likely to increase due to human influence. On the evolution of droughts on the other hand, no conclusions can be made due to lack of direct observations and the inconsistencies in drought trends (IPCC, 2014).
East Brazil
Also parts of Northeast Brazil are classified as semi-arid land and contain the Caatinga dry land biome. This region has reportedly been undergoing degradation and desertification in the recent years (CGEE, 2016). Recent NDVI evolution as measured by our approach, seem to suggest a slight decline after 2008. The cause for this declining NDVI can be linked to a decline in precipitation. This region indeed shows a great correlation between precipitation and NDVI. This can be confirmed by the extremities in the years 1993 and 2004, and again the declining trend of precipitation starting around 2008.
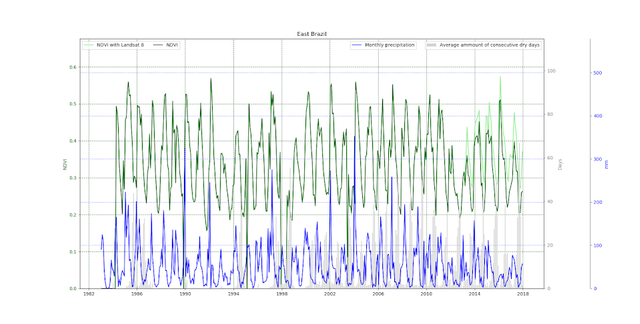
Brazil recently launched initiatives to counter these trends of degradation and desertification. For example the ABC Plan (Low Carbon Agriculture) launched around 2010 and aims to recover 15 millions hectares of already degraded lands by 2020. (CGEE, 2016; IPAM, 2012). Thus far, this effect is not visible through our approach.
Sahara
The Sahara desert as largest dry desert on the world also borders a very large amount of arid and semi-arid lands. A large part of these semi-arid lands are what make up the Sahel. Therefor the Sahara and especially its bordering dry lands in the Sahel are described abundantly when it comes to the topic of desertification. The region has historically been prone to droughts. The latest extreme started drought in 1968 and recovered slightly in 1974. This 6 year period of extreme drought took approximately 250.000 human lives and killed millions of livestock. This event gave the topic of desertification and its consequences the attention of the global community. Precipitation levels increased compared to 1968 but relative dry conditions remain until today (Lambrechts, 2011; Nicholson & Tucket, 1996).
When looking at the trends of NDVI and precipitation, a positive trends can be regarded for both variables. Maximal monthly precipitations for the region has steadily risen from below 40 mm to 50 mm and more. This might resemble only a small increase, but since this region also covers vast hyper arid lands, the changes had to occur on the more moderate regions and a significant change would only affect the mean slightly. This upward trend of NDVI has been observed by many papers and is seen as a greening of the Sahel (Dardel et al., 2014; Kaptué, Prihodko, & Hanan, 2015).
Other studies on the other hand call for caution since the results from remote sensing contradict field studies which document an opposite trend. Again has to be noted that NDVI is a proxy for the amount of chlorophyll and “greenness”. Increases in precipitation can cause grow spurts of herbal vegetation which significantly increases NDVI with its green leaves. Woody vegetation that vanished due to the extreme droughts and exploitations don’t return instantly but contribute greatly to the quality of the land and the ecosystem (Behnke, 2012).
Conclusion
Google Earth Engine has proven to be a valuable tool for processing large amounts of spatial data. Execution of all codes required no data storage or computation power on the user’s end which greatly simplified the process of data acquirement. The GEE however does not scale unlimitedly and boundaries are set on memory usage of users and the amount of simultaneous requests as already mentioned in the methodology. This limit on memory usage was often reached on a large scaled study such as this one and concepts such as the amount of consecutive dry days could not be deployed fully due to this limitation. Furthermore where there abnormalities in the data and trends of the amount of consecutive dry days that cannot be explained by looking at the available data. In particular data before 2000 was often lost and for some regions sudden changes after 2013 cannot be explained. But when looking at the remaining amount of data that could have been processed without any usage of the users computer, the results still offer a much larger access to broad scale data analysis. The date obtained with the GEE has proven to be accurate and relevant for all regarded regions and are comparable with other studies on the respective regions.
On the topic of desertification it can be stated that a well-defined and measurable definition of the phenomenon is required to successfully assess it’s effects. The trends that have been observed in NDVI seem to relate well to trends in precipitation. While human influences and interactions might determine if land is economically usable, they do not show in the trends, assuming the precipitation is experiences natural variations. Whether these variations are in fact natural, or also influenced by human activities is a topic for another study. Also the delineation of regions should have been based on climatological regions rather than geographical locations. This would allow for better comparison of climatological trends with the NDVI dynamics.
The trends discussed in the previous section were not tested for significance, thus final conclusions cannot be drawn based on this data. The reason behind this is the statistical complexity of testing the significance of a trend that already shows a complex temporal pattern. The actual test for significance for the data retrieved in this paper would make an interesting topic for future research.
Although this paper highlights the potential use of batch processing of remotely sensed data through open platforms for cloud computing such as GEE, it also points out limitations for reliably evaluating long term evolutions. Firstly, by aggregating spatial data from an entire region, local trends and internal structures are discarded. Therefor local and internally more homogeneous areas should still form the basis for precise studies on desertification. Secondly, using more factors than can be derived from remotely sensed data should be considered in order to better understand driving factors of desertification. Potential factors could be the temperature of the top soil, the ratio of precipitation and potential evapotranspiration or the Rain Use Efficiency. Furthermore, to truly understand the impact of climatic variation and human induced effects on desertification, a longer timespan needs to be regarded so longer lasting phenomena and cycles can be taken into account. Finally, and most importantly it is important to understand and use this analysis on the scale it was applied to, a generalized and continental scale. Evaluating desertification and efforts made by policymakers should continue on the scale relevant for the evaluation.

If you made it to the end, congratulations! I'll buy you a drink one day!
Bibliography
Mainguet, M., 1991: Desertification, Natural Background and
Human Mismanagement. Springer-Verlag, 306 pp.
Graetz, R. D., 1991: Desertification: A tale of two feedbacks. Ecosystem
Experiments, H. A. Mooney et al., Eds., Wiley, 59-87
Ashouri, H., Hsu, K. L., Sorooshian, S., Braithwaite, D. K., Knapp, K. R., Cecil, L. D., … Prat, O. P. (2015). PERSIANN-CDR: Daily precipitation climate data record from multisatellite observations for hydrological and climate studies. Bulletin of the American Meteorological Society, 96(1), 69–83. https://doi.org/10.1175/BAMS-D-13-00068.1
Barsi, J., Lee, K., Kvaran, G., Markham, B., & Pedelty, J. (2014). The Spectral Response of the Landsat-8 Operational Land Imager. Remote Sensing, 6(10), 10232–10251. https://doi.org/10.3390/rs61010232
Behnke, R. H. (2012). The end of desertification. https://doi.org/10.1016/S2352-3018(15)00029-6
Bureau of Meteorology. (2015). Recent rainfall, drought and southern Australia’s long-term rainfall decline. Retrieved May 16, 2018, from http://www.bom.gov.au/climate/updates/articles/a010-southern-rainfall-decline.shtml
Carr, N. (2009). Cloud Computing. In Encyclopaedia Britannica. Encyclopaedia Britannica, inc. Retrieved from https://www.britannica.com/technology/cloud-computing
CGEE. (2016). Land degradation neutrality : implications for Brazil Executive director.
Dardel, C., Kergoat, L., Hiernaux, P., Grippa, M., Mougin, E., Ciais, P., & Nguyen, C. C. (2014). Rain-use-efficiency: What it tells us about the conflicting sahel greening and sahelian paradox. Remote Sensing, 6(4), 3446–3474. https://doi.org/10.3390/rs6043446
FAO. (2010). Global Forest Resources Assessment 2010. FAO Forestry Paper, 163, 350 pp. https://doi.org/ISBN 978-92-5-106654-6
Feng, Q., Ma, H., Jiang, X., Wang, X., & Cao, S. (2015). What Has Caused Desertification in China? Scientific Reports, 5(1), 1–8. https://doi.org/10.1038/srep15998
Gorelick, N., Hancher, M., Dixon, M., Ilyushchenko, S., Thau, D., & Moore, R. (2017). Google Earth Engine: Planetary-scale geospatial analysis for everyone. Remote Sensing of Environment, 202, 18–27. https://doi.org/10.1016/j.rse.2017.06.031
Herring, J. W. and D. (2000). Measuring Vegetation (NDVI & EVI) : Feature Articles. Retrieved from https://earthobservatory.nasa.gov/Features/MeasuringVegetation/measuring_vegetation_2.php
Higginbottom, T. P., & Symeonakis, E. (2014). Assessing land degradation and desertification using vegetation index data: Current frameworks and future directions. Remote Sensing, 6(10), 9552–9575. https://doi.org/10.3390/rs6109552
IPAM. (2012). Brazil’s “Low-Carbon Agriculture” Program: Barriers to Implementation. Amazon Environmental Research Institute, 1–6. Retrieved from http://www.gcftaskforce.org/documents/brazil%27s_low-carbon_agriculture_program.pdf
IPCC. (2014). Summary for Policymakers. Climate Change 2014: Synthesis Report. Contribution of Working Groups I, II and III to the Fifth Assessment Report of the Intergovernmental Panel on Climate Change. https://doi.org/10.1017/CBO9781107415324
Kaptué, A. T., Prihodko, L., & Hanan, N. P. (2015). On regreening and degradation in Sahelian watersheds. Proceedings of the National Academy of Sciences, 112(39), 12133–12138. https://doi.org/10.1073/pnas.1509645112
Lambrechts, L. (2011). Implementering van de United Nations Convention to Combat Desertification : het Great Green Wall Initiative for the Sahara and Sahel.
Liu, C., & Wu, B. (2010). “Grain for green programme” in China: Policy making and implementation? THe University of Nottingham, China Institute, Policy Briefing Series, (60), 1–17.
Nicholson, S. E., & Tucket, C. J. (1996). Surface Vegetation : An Example ^ from the West African Sahel ^ ^.
Paruelo, J. M., Oesterheld, M., & Vero, S. R. (2006). Assessing desertification, 66, 751–763. https://doi.org/10.1016/j.jaridenv.2006.01.021
Peel, M. C., Finlayson, B. L., & McMahon, T. A. (2007). Updated world map of the Köppen-Geiger climate classification. Hydrology and Earth System Sciences, 11(5), 1633–1644. https://doi.org/10.5194/hess-11-1633-2007
Sternberg, T., Rueff, H., & Middleton, N. (2015). Contraction of the Gobi desert, 2000-2012. Remote Sensing, 7(2), 1346–1358. https://doi.org/10.3390/rs70201346
U.S. Geological Survey. (2015). Landsat—Earth observation satellites. Fact Sheet, 2020(August), 1–4. https://doi.org/10.3133/fs20153081
UNCCD, K. A. (2014). United Nations Convention to Combat Desertification: Issues and Challenges. Retrieved April 11, 2018, from https://www.e-ir.info/2014/04/30/united-nations-convention-to-combat-desertification-issues-and-challenges/
Veste, M., Jiarong, G., Sun, B., & Siegmar-W., B. (2006). The Green Great Wall -Combating desertification in China. Geographische Rundschau International Edition Vol., 2(3), 14–20. Retrieved from http://www.desertconsult.de/PDF/GR2006VesteChina.pdf
Vogt, J. V., Safriel, U., Von Maltitz, G., Sokona, Y., Zougmore, R., Bastin, G., & Hill, J. (2011). Monitoring and assessment of land degradation and desertification: Towards new conceptual and integrated approaches. Land Degradation & Development, 22(2), 150–165. https://doi.org/10.1002/ldr.1075
Xu, C., Li, Y., Hu, J., Yang, X., Sheng, S., & Liu, M. (2012). Evaluating the difference between the normalized difference vegetation index and net primary productivity as the indicators of vegetation vigor assessment at landscape scale. Environmental Monitoring and Assessment, 184(3), 1275–1286. https://doi.org/10.1007/s10661-011-2039-1
Yengoh, G. T., Dent, D., Olsson, L., Tengberg, A. E., & Tucker III, C. J. (2015). Use of the Normalized Difference Vegetation Index (NDVI) to Assess Land Degradation at Multiple Scales: current status, future trends, and practical considerations. https://doi.org/10.1007/978-3-319-24112-8
This is super cool stuff! I hope the defense goes well!
Thanks! I really enjoyed this topic and the possibilities with it are enormous! the sky is the limit ;)
Bravo, and good luck. You certainly seem to know your material. Can't imagine you'll have trouble defending your paper.
Thanks! I hope they won't be to harsh on the fact that I didn't check for significance, but it was a fun project indeed.
Congratulations! This excellent post was chosen by the new curation initiative of the @postpromoter content promotion service to receive a free upvote!
This post exemplifies the type of great content that we at @postpromoter enjoy reading and would love to see more of on the Steem platform. Keep up the good work!
You have recieved a free upvote from minnowpond, Send 0.1 -> 2 SBD with your post url as the memo to recieve an upvote from up to 100 accounts!
You got a 12.25% upvote from @postpromoter courtesy of @postcurator!
Want to promote your posts too? Check out the Steem Bot Tracker website for more info. If you would like to support the development of @postpromoter and the bot tracker please vote for @yabapmatt for witness!
This post has just received lots of ♡♡♡#LOVE♡♡♡ and a 50.00% upvote from @haveaheart!
Thank you for your thoughtfulness in choosing this service.
@haveaheart donates 10% of all received profit to the Sri Sathya Sai Heart Hospital
If you would like to delegate to @haveaheart we would appreciate the support and you will be contributing to a wonderful cause. Our delegators receive 85% and receive daily payouts.
Click here to delegate! (Be sure to leave at least enough SP undelegated that your account is still usable.)
#haveaheart ♡
This is a very educative article and i really appreciate you for taking time to write this. Did you know today is world day to combat desertification? We are carrying out activities and its great to be an actor championing the fight against desertification
Oh I didn't know that! what kind of activities do you carry out today?
https://steemit.com/desertification/@thegreens/did-you-know-your-every-day-actions-are-significantly-contributing-to-desertification-world-day-to-combat-desertification
Cool paper and I hope the defense went well! Sorry I did not see this until now so I could not upvote it then...
Thanks! The defense was last Saturday and it went alright! I made some initial mistakes such as the regions that could have been defined better (choosing smaller climatological regions in stead of geographical) and the Earth Engine also posed limitations, but they were impressed by the overal method and code that was used so there's that :)
Congratulations. And putting your work here gets the community closer to pure blockchain science. Peer to peer and getting rid of publishing all together. Word of advice, people will always critique and as long as you learn and grow from it, it is a win win situation!
Critique is indeed good (as long as it is constructive), and I was aware of most of it already so that's a good thing. Decentralized publishing actually sounds very interesting... Nothing reward based, but like steemit where reputation influences one's opinion on the subject... Nice food for thought ;)
Agreed Re: constructive criticism. For me there is the timestamp aspect more than the reputation.
The reason why I am less keen on the reputation as the main indicator is that there are tons of brilliant people without degrees or fancy titles that can give amazing insight into how the universe operates. If those people present something first and this is recorded on the blockchain then they get credit for it. Perhaps?
There is loads of talent out there, I mean we have a bot that detects Haiku (here is looking at you @haikubot).
Nevertheless, putting a timestamp, a bit of a credit to the IP you, or whomever created, to give credit where credit is due. Thanks again.