Forex part 3
Hallo warga steemit yang berbahagia, setelah kemarin saya membahas indikator Bollinger Bands yang mana bisa digunakan sebagai pengukur kondisi titik jenuh pembelian dan penjualan, dimateri ke 2 saya https://steemit.com/forex/@ancommunity/forex-part-2
Hello, happy steemit citizens, after yesterday I discussed the Bollinger Bands indicator which can be used as a measure of the saturation point of buying and selling, my second material https://steemit.com/forex/@ancommunity/forex-part-2
Nah pada kesempatan ini saya akan membahas Indikator Moving Average yang terdiri dari 3 jenis yaitu Simple Moving Average (SMA), Exponsial Moving Average (EMA) Dan Weight Moving Average (WMA) yang tidak kalah penting jika dimasukkan dalam daftar penggunaan indikator. Moving Average juga berfungsi sebagai penghalus tampilan pucuk candle stick yang bergerigi selama periode tertentu, sehingga akan membantu mempermudah mengenali tren atau arah pergerakan harga secara umum.
Now on this occasion I will discuss Moving Average Indicators which consist of 3 types, namely Simple Moving Average (SMA), Exponential Moving Average (EMA) and Weight Moving Average (WMA) which are no less important if included in the list of indicators. Moving Average also functions as a smoothing display of the candle sticks that are jagged during a certain period, so that it will help make it easier to recognize trends or the direction of price movements in general.
Moving Average cukup banyak digunakan oleh para trader, selain tampilannya yang sederhana dalam memberi gambaran pergerakan pola harga pada periode tertentu, Indikator ini pun bisa digunakan sebagai penentu trend atau perbalikan harga dengan cara penggabungan 2-3 garis Moving Average beda periode dalam 1 tampilan.
Moving Average is quite widely used by traders, in addition to its simple appearance in giving a picture of the movement of price patterns in a certain period, this indicator can also be used as a determinant of trend or price reversal by combining 2-3 lines of Moving Average for different periods in 1 view.
Dari segi tampilan Moving Average hanya berbentuk garis horizontal dengan satuan peripde 1-100, dan bisa kita atur sendiri, semakin kecil periode yang digunakan maka akan semakin rapat pula tampilannya, semakin besar periode yang kita gunakan maka semakin renggang pula tampilannya.
In terms of appearance the Moving Average is only in the form of a horizontal line with peripde units 1-100, and we can set it ourselves, the smaller the period used, the closer the appearance will be, the greater the period we use, the more distant the display.
Pernah lihat garis kurva pada pelajaran matetika atau garis pada sandi rumput pramuka?. Nah semakin kecil periode Moving Average tampilannya akan seperti sandi rumput, semakin besar periode yang digunakan maka akan semakin mirip dengan kurva pada pelajaran matematika.
Have you ever seen the curve lines in the mathematics lesson or the lines in the scout grass codes ?. Now the smaller the Moving Average period it looks like a grass password, the bigger the period used it will be more similar to the curve in mathematics.
Pada dasarnya, Simple Moving Average dihitung dengan menjumlahkan beberapa harga penutupan atau pembukaan terakhir, disini saya sebut X periode, dan kemudian membagi jumlah tersebut dengan X. Hasilnya akan menjadi rata-rata bergerak yang terus berubah seiring dengan perjalanan waktu, selama harga masih dimumculkan.
Basically, the Simple Moving Average is calculated by adding up the last few closing or opening prices, here I call X period, and then dividing that number by X. The result will be a moving average that changes over time, as long as the price is still raised.
Apabila trader mengiginkan tampilan perhitungan harga baik pembukaan atau penutupan dalam periode 5, maka Simple Moving Average pada grafik 1-jam akan menambahkan harga pembukaan ataupun penutupan selama 5 jam terakhir, dan kemudian membagi jumlahnya dengan 5, dan SMA akan menampilkan harga penutupan rata-rata selama 5 jam terakhir.
If a trader wants to display a price calculation for either opening or closing in period 5, the Simple Moving Average on the 1-hour chart will add the opening or closing price for the last 5 hours, and then divide the amount by 5, and the SMA will display the average closing price for the past 5 hours.
Rumus SMA : Tampilan MA = Harga terakhir ÷ periode = harga rata-rata selama 5 jam. Harga itulah yang akan ditampilkan dalam tampilan Chart.
SMA formula: MA display = Last price ÷ period = average price of 5 hours. That price will be displayed in Chart view.
Apabila ingin menaruh Simple Moving Average periode 5 pada grafik 10 menit, maka Anda akan menambah rentan harga dari 50 menit terakhir dan kemudian bagi jumlahnya dengan 5.
If you want to put a Simple Moving Average for period 5 on the 10 minute chart, then you will add price vulnerability from the last 50 minutes and then divide the amount by 5.
Begitupun jika menggunakan Simple Moving Average periode pada grafik 30 menit, maka SMA akan menampilkan harga penutupan dari 150 menit terakhir dan kemudian membagi jumlahnya dengan 5. Hal yang sama juga berlaku untuk perhitungan Simple Moving Average pada tampilan waktu yang lebih tinggi.
Likewise, if you use the Simple Moving Average period on the 30 minute chart, the SMA will display the closing price of the last 150 minutes and then divide the amount by 5. The same applies to the calculation of the Simple Moving Average at a higher time display.
Umumnya tampilan tampilan Simple Moving Average akan dihitung secara otomatis oleh software, sehingga memudahkan trader. Meski demikian, cara menghitung Simple Moving Average itu sangat penting untuk dipahami, untuk mengetahui cara mengedit dan cara kerja pada indikator tersebut.
Generally the Simple Moving Average display will be calculated automatically by the software, making it easier for traders. However, how to calculate the Simple Moving Average is very important to understand, to know how to edit and how to work on these indicators.
Memahami bagaimana cara memahami indikator tersebut bekerja, berarti kita sudah dapat mengatur dan menciptakan strategi yang berbeda, maupun menggunakannya dalam trading.
Understanding how to understand these indicators works, means we can set and create different strategies, and use them in trading.
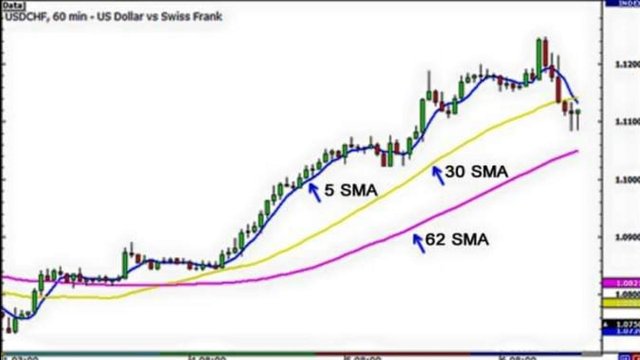
Pada gambar grafik di atas, terdapat 3 buah SMA yang berbeda pada Chart Time Frame 1 jam, pada pasangan mata uang USD/CHF. Seperti yang kita lihat, semakin besar periode SMA, maka akan semakin tertinggal harganya. Kemudian coba kita perhatikan bagaimana SMA periode 62 berada lebih jauh dari pergerakan harga dibanding SMA periode 30 dan SMA periode 5.
In the chart above, there are 3 different high schools on the 1-hour Time Frame Chart, on the USD / CHF currency pair. As we can see, the greater the high school period, the lower the price will be. Then let us consider how the SMA 62 period is further away from price movements than the 30 period SMA and 5 period SMA.
Hal ini dikarenakan SMA periode 62 menambahkan hingga harga penutupan 62 periode terakhir dan kemudian membaginya dengan 62.
This is because the 62 period SMA adds up to the closing price of the last 62 period and then divides it by 62.
SMA dalam gambar tersebut menunjukkan secara keseluruhan sentimen pasar pada titik waktu ini.
The SMA in the picture shows overall market sentiment at this time point.
Di sini, kita dapat melihat bahwa pasangan mata uang USD/CHF ini trendnya sedang beranjak naik. Tidak hanya menunjukkan pergerakan harga pasar saat ini, Moving Average memberi kita pandangan yang lebih luas, dan kita sekarang dapat mengukur secara umum arah pergerakan suatu harga di masa depan.
Here, we can see that the USD / CHF currency pair is trending up. Not only shows the current market price movements, Moving Average gives us a broader view, and we can now measure in general the direction of movement of a price in the future.
Pada umumnya, trader menganggap harga sedang bergerak naik, jika harga sekarang berada di atas SMA. Sebaliknya, harga dianggap sedang bergerak menurun jika harga sekarang berada di bawah SMA.
In general, traders assume the price is moving up, if the price is now above the SMA. Conversely, the price is considered to be moving downward if the price is now below the SMA.
Selain itu, persimpangan (crossover) yang muncul ketika SMA dengan periode terkecil (misalnya 5) melintasi SMA lainnya dengan periode lebih tinggi (misalnya 30 dan 62), seperti yang nampak di sisi paling kiri pada gambar di atas, bisa dibaca sebagai awal dari pergerakan harga sedang naik.
In addition, the crossing (crossover) that appears when the SMA with the smallest period (eg 5) crosses another SMA with a higher period (eg 30 and 62), as seen on the far left side in the picture above, can be read as the beginning of the movement prices are rising.
Dengan menggunakan SMA, kita bisa tahu apakah pasangan itu trennya sedang naik, turun, atau hanya sideway. Hanya saja, terdapat satu permasalahan pada Simple Moving Average, yaitu rentan terhadap lonjakan, karna SMA sendiri cukup sensitif dalam memprediksi pergerakan harga.
By using high school, we can know whether the pair is trending up, down, or just sideways. However, there is one problem with the Simple Moving Average, which is vulnerable to surges, because SMA itself is quite sensitive in predicting price movements.
Ketika hal ini terjadi, maka akan timbul sebuah sinyal palsu pada chart yang kita amati. Dengan demikian, kita dapat berpikir bahwa tren baru akan segera berkembang, tetapi dalam kenyataannya, tidak ada yang berubah.
When this happens, a false signal will appear on the chart that we observe. Thus, we can think that a new trend will soon develop, but in reality, nothing has changed.
Apabila kita menggunakan indikator Simple Moving Average pada sistem trading, sebaiknya menggunakan indikator tambahan seperti Bolinger Bands atau Oscilataor untuk mengkonfirmasi pergerakan, agar tidak terjebak sinyal palsu.
If we use the Simple Moving Average indicator on the trading system, it is better to use additional indicators such as Bolinger Bands or Oscilataor to confirm the movement, so as not to get caught false signals.
Sementara ini dulu ya, untuk 2 MA lainnya nanti, sambil nunggu jatah dana konpensasi hasil sedekah 7 juta umat cair.
Hehehe..
Selamat sore selamat beristirahat.
While this used to be yes, for the other 2 MAs later, while waiting for the allocation of funds from the donation of 7 million people to be disbursed.
Hehehe...
Good afternoon have a good rest.
Untuk melakukan perdagangan di OlympTrade bisa daftar di link di bawah ini supaya mendapatkan100% bonus deposit
https://bit.ly/2RNQKQH

Thanks for using eSteem!
Your post has been voted as a part of eSteem encouragement program. Keep up the good work!
Dear reader, Install Android, iOS Mobile app or Windows, Mac, Linux Surfer app, if you haven't already!
Learn more: https://esteem.app
Join our discord: https://discord.me/esteem