How Use Excel T.TEST - Was a Marketing Campaign Successful?
Like z-tests, t-tests ( and Excel T.test function) are calculations used to test a hypothesis, but they are most useful when we need to determine if there is a statistically significant difference between two independent sample groups. In this article we will look at T.TEST in Excel.
A t-test asks whether a difference between the means of two groups is unlikely to have occurred because of random chance. Usually, t-tests are most appropriate when dealing with problems with a limited sample size (n < 30).
Now you might think that comparing the averages are easy, but averages are affected by outliers and can give misleading results. You may also have situations where the sample and population sizes are different. Lets say you have a drug for the flu, and patients that take it get better on average in 3 days, and patients that don’t get better on average 5 days. The T. Test can be used to see if this difference if by fluke or because of the drug.
Another Example would be to test to see if the change in sales are down to a successful marketing campaign or if the change in sales happened by chance.
Example Excel T.Test
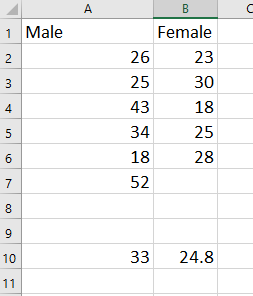
Our table of data represents the age of employees within a company. There are 6 male employees with an average age of 33 and 5 female employees with an average age of 24.8.
We wish to see if the difference between the mean of the males age and the mean of the female age is unlikely or likely to have happened by chance.
We can write out our hypothesis test as:
- HO the difference between the mean of the males age and the mean of the female age is unlikely to have happened by chance and have no statistically significant difference
- HA the difference between the mean of the males age and the mean of the female age is likely to have happened by chance and have a statistically significant difference
Understanding T.TEST requirements
Lets first look at the syntax of Excel T.TEST function.=T.TEST(array1, array 2, tails, type)Where array 1 and 2 are the observations.
Tails; select between 1 tailed or 2 tailed. A one tailed test is where only an increase or decrease in observations between tests. Two tailed tests are where you would find both increases and decreases in observations between tests. Looking at our data, both the male observations ages increase and decrease and so does the female observations. Therefore, we have a 1 tailed test.
The last item in Excel T.Test is Type. We must select between paired, two sample equal variance and two sample unequal variance.
A paired sample is where the same sample is used for both tests. If the test is not a paired you must then select between equal or unequal variances.
F.TEST in Excel
To test your sample data and see if you have equal or unequal variances you can use excels F.TEST function. The F-Test is used to test the null hypothesis that the variances of two populations are equal, the alternative hypotheses is that the populations have unequal variances.
We could write out our hypothesis as
- HO variances of two populations are equal
- HA variances of two populations are not equal
=F.TEST(array1, array2)Where array 1 and 2 are the observations.
The result will be a value of <=1. 1 representing a totally equal variance, the smaller the number gets the larger the variances. The result is the probability shown as a two tailed test. If you have a 1 tailed test then the values should be divided by 2. In this case we have already established this is a one tailed test.
If the value returned is >0.05 (alpha) we would accept the null hypothesis that the variances of two populations are equal. If the value is not equal to <=0.05 we would reject the null hypothesis. As the value for the one tailed test is greater than 0.05 we can therefore accept the null. As we know now that the variances are equal we can go ahead with our T.TEST
Compiling the T.TEST
=T.TEST(array1, array 2, tails, type)Array 1 being male employees, array 2 being female. We know we have a 1 tailed test and we know they type is of equal variance.
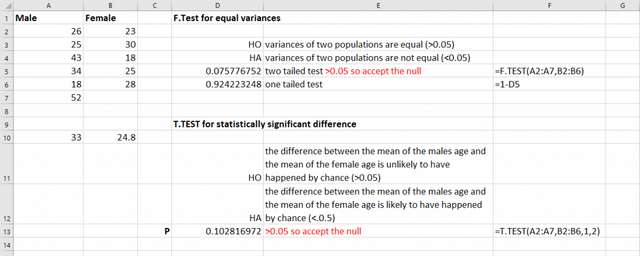
The T.TEST returns a P value. This P value is the probability that there is no statistically significant difference between the two data sets.
If the P value returned is >0.05 (alpha) we would accept the null hypothesis that the variances of two populations are equal. If the value is not equal to <=0.05 we would reject the null hypothesis.
As the P value returned in this case is 0.102, greater than 0.05, we can accept the null hypothesis and say there is a statistically significant differences between the age of male employees and female employees which did not happen by chance.
Learn and Earn Activity
A company runs a marketing campaign and has sale values for the 7 days before and for the 7 days of the campaign. They wish to establish if the increase in average sales was down to the marketing campaign or just by fluke.
We wish to see if the difference between the mean sales pre-campaign and and the mean of the during the campaign is likely or unlikely to have happened by chance.
Copy the table of data below and work out if you could call the marketing campaign a success or not by carrying out a T.TEST
| Pre Marketing | During Marketing | |
| Monday | 649 | 1070 |
| Tuesday | 654 | 799 |
| Wednesday | 961 | 575 |
| Thursday | 816 | 940 |
| Friday | 663 | 917 |
| Saturday | 623 | 714 |
| Sunday | 599 | 748 |
Before you watch this video, do carry out the activity and post your comments, questions or feedback in the comments section below.
The best comments will be upvoted and rewarded with STEEM.
You can find out more about our Excel Learn and Earn Activities here
Sign up for my newsletter – Don’t worry, I wont spam. Just useful Excel and Power BI tips and tricks to your inbox
SIGN UP NOWIf you liked this post - How Use Excel T.TEST - Was a Marketing Campaign Successful? - Please do share. The share buttons are just below the comments!
Cross posted from my blog with SteemPress : http://theexcelclub.com/how-use-excel-t-test-was-a-marketing-campaign-successful/
Perhaps it is too late to join the conversation, but I'll try anyway.
I agree with the comment regarding the assumption of normality. In this case, a normality test based on such a small sample will likely fail to reject the null hypothesis simply because there isn't enough data to say otherwise. But for fun, I researched and applied several different tests for normality using Excel (Geary test, Chi Sq Goodness of Fit, and Chi Sq Normality Test), all of which returned high p-values indicating one would fail to reject the null hypothesis and move forward with the assumption of normality.
For the marketing question - Was a Marketing Campaign Successful? My null hypothesis was one of no change; there was no difference in sales as a result of the marketing campaign. My alternative hypothesis was that the sales prior to the marketing campaign were less than the sales experienced during the marketing campaign. My thought is that I would not want the continued expense associated with a marketing campaign if it did not result in higher sales.
I conducted an F-test which returned a p-value larger than 0.05, so I fail to reject the null hypothesis and conclude that the variances are equal.
Now, I conduct the t-Test which returned a p-value larger than 0.05 (0.0889), so I fail to reject the null hypothesis and conclude that there was no difference in sales as a result of the marketing campaign.
So, rather than continue to spend money on this campaign, I'll allocate it to other marketing activities. :-)
its never too late to join the conversation, glad to have you onboard :-). What an awesome comment! it's great to see you did a little more work and I hope others also read this comment!
Based off the table above I could call marketing campaign a success by carrying out a T.TEST
- Kenroy Hunter
Learn and Earn Activity 8:
Copy the table of data below and work out if you could call the marketing campaign a success or not by carrying out a T.TEST
By using the T.TEST, the marketing campaign turned out to be a success.
T-Tests are for data we can assume is normally distributed. That applies for much human data, but isn't always true.
T-Tests are also not useful for ordinal (ranked, but the number doesn't represent the distance between the ranks) or nominal (category) based data.
The most common misuse I see of T-Tests is when examining Likert-like data (e.g. 0 = Never, 1 = Rarely, 2 = Sometimes, 3 = Often, 4 = Frequently, 5 = Always). This data is ordinal because it is ranked but the distance between ranks is not clear. For this kind, of data use something like: Wilcoxon or Mann-Whitney.
T-Test is still a great test to use!
Hay and thanks for visiting. Yes this is true, T.TESTS are not good for ordinal data at all. However it is good for the examples shown. I must check to see if excel has built in functions for Wilcoxon, although it might be a combination of functions.
Testing has always been a week point of mine even though I know it is imperative for success and profitability.
Thanks for this excellent training on a new way (new to me) of testing!
you are welcome