Ethereum Price analysis 14/02/2018

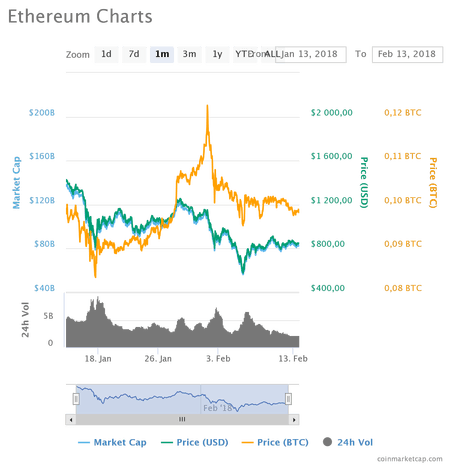
If the price fall Below 800 USD, this means that there is a bearish movement that will happen on the Ethereum Chart and then we will see the price around 778 USD, then 739 USD .
If the price break the resistance level of 921 USD, then this means that there another bullish movement that will start on the ethereum chart, the next target are 1000 USD, then 1200 USD .
But this levels right now from 800 USD to 870 USD, are good entry point for a long term on Ethereum .
Any question about Crypto trading :
Add me on Facebook
Follow me on Twitter
Follow me on Instegram
Protect your Crypto currenct against Hackers with Ledger
Trade Crypto currency on the largest crypto exchange in the world withLivecoin
Trade crypto currency and cashout your profit using Payza and Advcash on Exmo