ETH
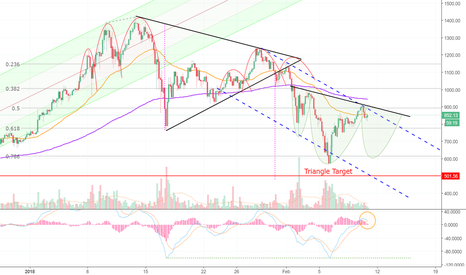
Hi friends! Welcome to this update analysis on Ethereum! Let's jump right in. Looking at the four hour chart, you can see that there are a few new developments, since my last chart. If you recall from the ETH analysis "Delirium in Ethereum!" we were assessing the development of the inverse head and shouldassessing the development of the inverse head and shoulders pattern, that we hypothesized in the "MagicPoopCannon's Visionary Workshop" post. The original hypothesis of a developing inverse head and shoulders pattern involved a flat neckline at the 38.2% retrace. However, as the chart developed, a few things have changed, and we can see now that the would-be neckline appears to be sloping downward (in black.) Additionally, you can see that ETH has developed an apparent downtrend channel (blue dashes.) Looking at the chart, you can also see that ETH is now taking a pause just under the 50 EMA (in orange.) The 50 EMA has been quite problematic for the bulls, and ETH appears to be failing at it, yet again. Also, the MACD is poised to cross over bearish (orange circle,) increasing the likelihood of downside in the near future. With that said, I think the entire crypto market is trying to bottom around here. Perhaps we will make one more push lower, to flush out the weak hands, and then ultimately reverse back to the upside, completing this inverse head and shoulders pattern. That is pure speculation, however, so we need to see further evidence materialize on the chart, to confirm this hypothesis. If you'd like to know why I think the market could be bottoming here, it's because there are huge bullish divergences on many of the coins that I cover, some reversal patterns are beginning to emerge, and the buy-side volume is really starting to pick up. In terms of divergences, you can see that ETH has formed two equal lows on the MACD , while price has formed lower lows. So for ETH, this isn't an extremely strong divergence, but it is a divergence, none-the-less. What this is telling us, is that the sell-side momentum has been falling, on a broad scale, over the entire course of this bear market correction. The bears are losing momentum, and at some point, the bulls could rescue this market in a powerful way. Until then, we need to keep in mind that this is still a bear market, and the bears are in control. On the downside, look for a test of the 61.8% retrace as initial support. Remember, the 50 EMA , the downtrend channel , the neckline of the inverse head and shoulders pattern, and the 50% retrace are all resistance, and they're just above the current price actoin. Therefore, the path of least resistance remains to the downside.
It falls! It was so and a correct answer.
Posted using Partiko iOS