EOS Technical Analysis: THE RANGE IS TIGHTENING

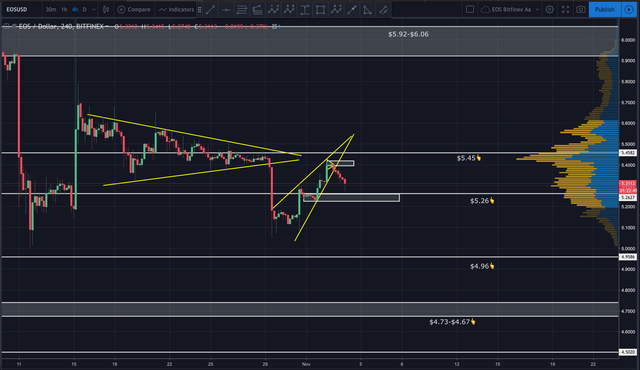
EOS broke down and out of a bearish rising wedge and seems to be looking for support. I’m watching the prior order block around the $5.26 support for a possible bounce/reversal.
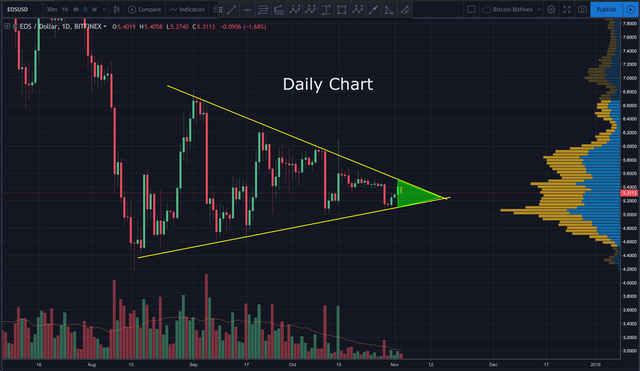
Zooming out on the daily chart, we can see EOS continues to trade within a tighter and tighter range.
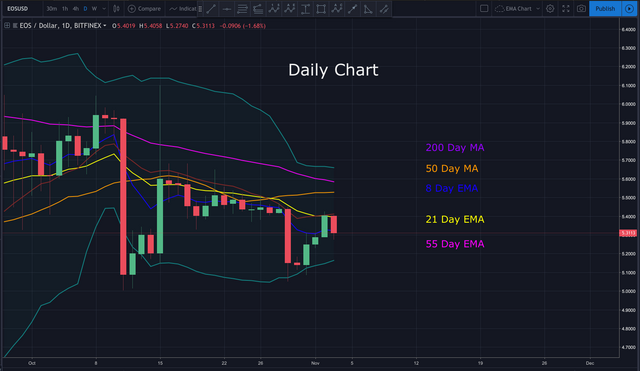
Price was rejected at the 21 day EMA on the daily, and just dropped below the 8 day EMA.
In today’s video analysis I discuss, where price may go from here, how I’m trading EOS, market psychology and so much more. I hope you find it helpful.
Video Analysis:
If you don’t see the above video, navigate to TIMM (https://mentormarket.io/profile/@workin2005) or Steemit in order to watch.
I hope this has been helpful. I’d be happy to answer any questions in the comment section below. Until next time, wishing you safe and profitable trading!
Workin
If you found this post informative, please:

Open an Account on Binance here:
https://www.binance.com/?ref=16878853
Support the Crypto Ecosystem with Brave Browser:
https://brave.com/wor485
Twitter handle is @Workin2005 and Facebook is https://www.facebook.com/Workin2005
Published on:

by Workin2005

The noise on the smaller charts can really take one for loops, so it's cool that you showed the daily chart to keep things in perspective.
Thanks Rolland.