Bullish Gartley Pattern in Ethereum | Technical Analysis by Whaleagent | 8.12.2018
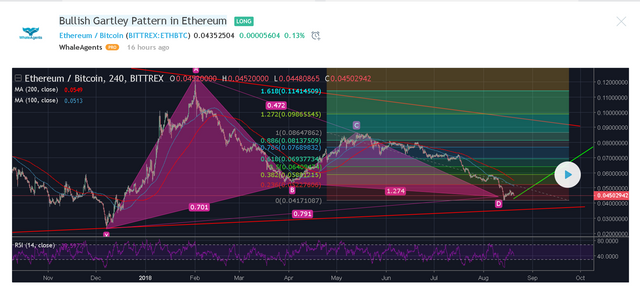
The Gartley pattern is the most common harmonic chart pattern. The bullish version of Gartley predicts an end to the short-term bearish bias and an upcoming trend higher. Once the price reaches point D, which in a perfect Gartley pattern is located between 127.2 and 161.8 Fibonacci extension zones, a rebound is expected. A profit-taking zone is between 38.2 and 61.8 Fibonacci of the CD points, depending on the trading style. A stop should be placed below the 161.8% Fibonacci extension zone. The Gartley pattern is easy to identify and trade it is quite reliable.
➖➖➖➖➖➖➖➖➖➖➖➖➖➖➖➖
🌐 FREE Cryptocurrency Signals
🌐 Follow us on Twitter
🌐 Visit our Official Website
🌐 About WhaleAgents
🌐 Original post in our Tradingview profile
➖➖➖➖➖➖➖➖➖➖➖➖➖➖➖➖

Congratulations @whaleagent! You have completed the following achievement on Steemit and have been rewarded with new badge(s) :
Click on the badge to view your Board of Honor.
If you no longer want to receive notifications, reply to this comment with the word
STOPTo support your work, I also upvoted your post!
Do not miss the last post from @steemitboard:
SteemitBoard and the Veterans on Steemit - The First Community Badge.