STEEM Technical Analysis: Possible breakage of the Long Term Resistance ahead
This is the kind of situations on which, as an amateur practitioner of the Technical Analysis, you want to reach in the follow-up of any of your favorite Crypto pairs, in this case STEEM/USD:
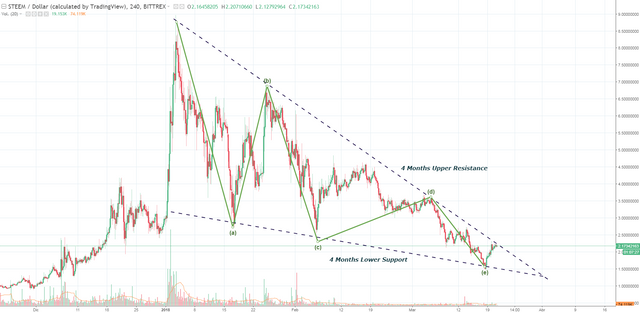
In the chart you can see two dashed lines which represents the upper and lower trendlines of STEEM in its correction.
"A trendline is a line drawn over pivot highs or under pivot lows to show the prevailing direction of price. Trendlines are a visual representation of support and resistance in any timeframe. Trendlines are used to show direction and speed of price, and also describe patterns during periods of price contraction."
Read more.
As usual, those two lines give us good indications of a possible change of sentiment of the market, for instance, in the chart above STEEM is close to the 4-months Upper resistance line, in this case, if STEEM is able to break that line strongly we may definitely say that "sentiment" is changing from BEARISH to BULLISH.
By the contrary, if it rebounds we should wait to see what happen over the lower support.
Stay tuned, STEEM may bring some happiness to us in short!
Just Dream and Enjoy Cryptoland!
*This is just my personal point of view, please, do your own assessment and act consequently.
i'd say is a good moment to buy more steem, if the bears keep ruling arround don't seem it can go much lower and if the bulls appear you'll be on the wave
That's exactly what I can deduct now from the observation of the chart, not less and not more.
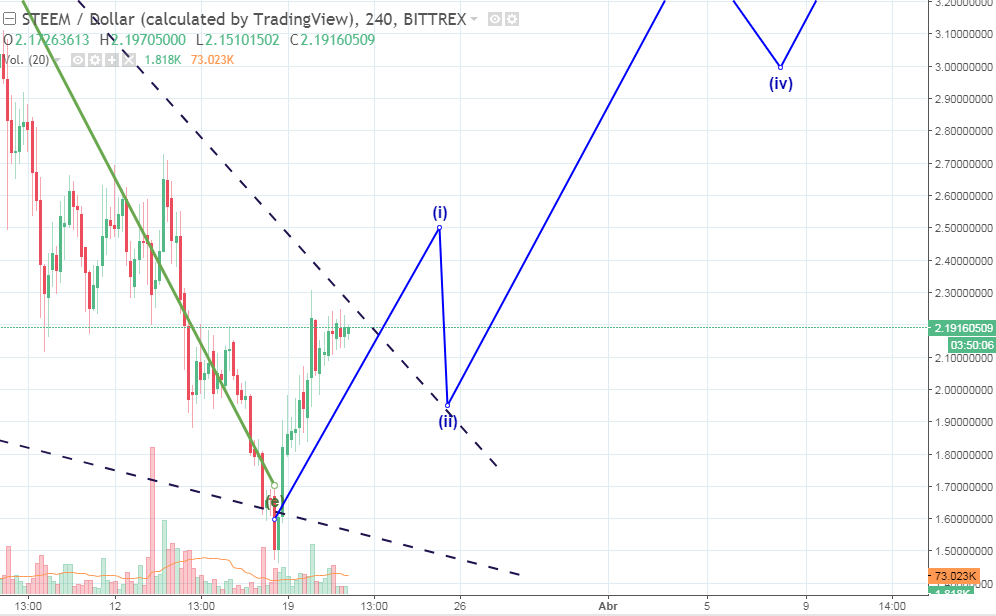
If I would be awaiting for a good moment to buy, I would choose the moment on which that upper trendline resistance would be broken.
It’s starting to look like wonderland!😁
Sigo sin darle ninguna fiabilidad a esta pseudociencia que es el análisis técnico. Lo único real es la tendencia, y ésta sigue siendo bajista.
Me alegro. La tendencia es Análisis Tecnico también, igual de fiable, tendencias es lo que utiliza la pseudo ciencia...si no, sería muy fácil, no crees? Trendline=línea de tendencia
Mmmmmm... No. La tendencia es clara. Se ve, no se intuye.
Dibujar un par de líneas que representan un triángulo y predecir que a continuación la tendencia pasará a ser alcista es pseudociencia. Puede pasar o no. Ese triángulo es igual de visible que la tendencia, pero su existencia no implica la predicción de cambio de tendencia.
Los planetas giran alrededor del Sol siguiendo un modelo matemático basado en la observación y demostrado como válido.
Ningún modelo matemático puede aplicarse al análisis técnico. Es un 50%/50% fiable. No es científico.
Si pudiese ver las carteras de aquellos que aprovechan el análisis técnico, me llevaría una desilusión por no estar yo aplicándolo. Deben estar ganando mucho dinero. No lo discuto. Pero éso sigue sin hacer que el análisis técnico deje de ser una pseudociencia.
y dale...me parece muy bien @javirid que lo consideres pseudociencia, mira, para que te quedes tranquilo, yo tambien...
Esas dos lineas las dibujo yo porque me sirven para poner referencias al asunto, tu cogelas o dejalas...o mejor, haz tu propio analisis! Te vuelvo a repetir, que esas lineas son LINEAS DE TENDENCIA, marcan una frontera, la que yo OBSERVO y con ellas saco mis conclusiones y, a veces, hasta decisiones...
A trendline is a line drawn over pivot highs or under pivot lows to show the prevailing direction of price. Trendlines are a visual representation of support and resistance in any timeframe. Trendlines are used to show direction and speed of price, and also describe patterns during periods of price contraction.
Ps. No hace falta que me expliques las leyes de Kepler ahora
Would be nice, because these low payouts are terrible! :(
Yes, hahahha, it is becoming so long...