What are the Main Crypto Trading Technical Analysis Indicators?
Would you like to learn about 5 main crypto trading technical analysis indicators because this might help you decide when it is the right time to enter or exit a trade?
What are the Main Crypto Trading Technical Analysis Indicators?
Cryptocurrencies are much more volatile than any other asset class. That is why the potential to make intraday or short-term profits in cryptocurrencies is much higher as compared to any other asset class.
With the help of technical analysis, you will be able to profitably trade cryptocurrencies in the shorter term.

Technical Analysis which is also known as TA in short, involves reading the chart-based technical indicators in order to gain an idea regarding the future movement of the cryptocurrency.
With the help of technical analysis, short-term trading positions can be initiated. With that being said, when you are looking to utilize the technical indicators based on technical charts, you will understand that there are quite a few of them.
With so many different confusing names and jargon thrown into the mix, it can be a daunting task to pick the right technical indicators.
We will solve that problem for you today as we will share the top 5 indicators, which you can utilize to trade in cryptocurrencies.
1. Simple Moving Averages (SMA)
Simple Moving Averages are exactly what the name suggests. The 100-day simple moving average is the price derived after averaging the price of cryptocurrencies across 100 days.
Similarly, the 10-day simple moving average is the average of the price movement in the last 10 days.
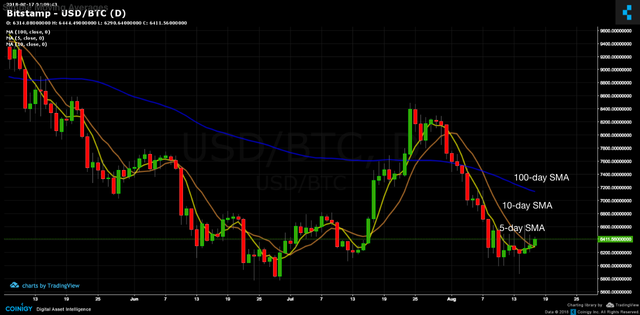
In cryptocurrency trading, the 5-Day SMA and the 10-day SMA hold a lot of importance. In case, the SMA is above the current price of the cryptocurrency, it will act as a resistance. If it is below, it will act as a support.
Another meaning, which can be derived from the SMA, is that if the 5-day SMA is below the 10-day SMA, that indicates that the asset classes in the bearish trend.
Similarly, if the 5-day SMA is above the 10-day SMA, that is a clear indication that the price is going to move upwards.
Most of the technical charts software, allows you to generate the 5-day SMA and the 10-day SMA automatically across the charts. This ensures that you are able to get these averages plotted instantly and accurately.
2. Relative Strength Index (RSI)
The Relative Strength Index is also known as RSI in short, and is a technical indicator which lets you know whether the asset class is in the overbought category or the oversold category. This indicator takes into account the price movements of the cryptocurrency and tries to predict the trend to help you trade.
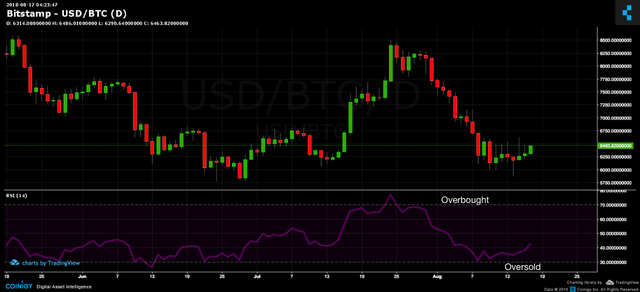
The value of RSI fluctuates between 0 to 100.
Anything above 80 can be considered as overbought. When the cryptocurrency is trading in the overbought zones, it is a good idea to book profits or stay away from the cryptocurrency.
Similarly, anything below 20 can be considered as oversold. In such a case, you have to look at appropriate buying opportunities. With the help of the relative strength index, you will be able to gain an idea about the momentum and the direction.
3. Volume
This is the most common, but most overlooked technical indicator which you can use. The daily volume in any cryptocurrency will let you know whether there is any kind of anticipation or buildup in the cryptocurrency.
Even though stand-alone, the volume will not help you initiate a trade, but it can be used as a confirmation pattern for other signals.
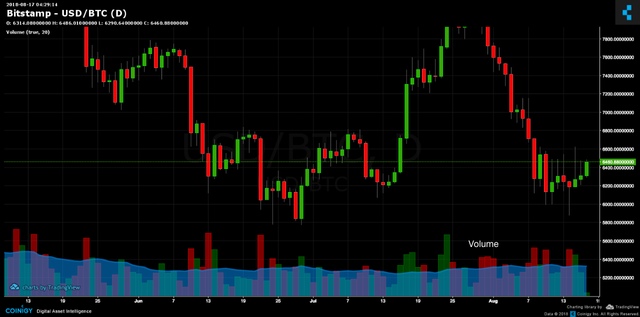
When you are able to build a strategy based on the other signals and if the volume in that particular cryptocurrency is also building up, that works as a confirmation that your prediction is right. In such a case, you can go ahead and initiate your trade.
Similarly, you can use it with conjunction with the SMA. If the asset is going to break the SMA on the upper side, it is going to break a resistance, and it should be accompanied by heavy volumes. Only when it is accompanied by heavy volumes, the breakout will be sustainable. Similarly, if the support is going to be broken on the lower side, it should again be with heavy volumes.
As you can see, the volume on a stand-alone basis will not be able to help you much, but when used in conjunction with the other technical indicators, it can help you greatly.
4. Moving Average Convergence Divergence (MACD)
MACD is a price oscillator, which is trusted by many intraday and swing traders. It analyzes the price movement of the asset class between 3 exponential moving averages.
The short-term exponential average is the 12-day average and the long-term exponential average is the 26-day average.
Additionally, the 9-day exponential moving average is used as well.
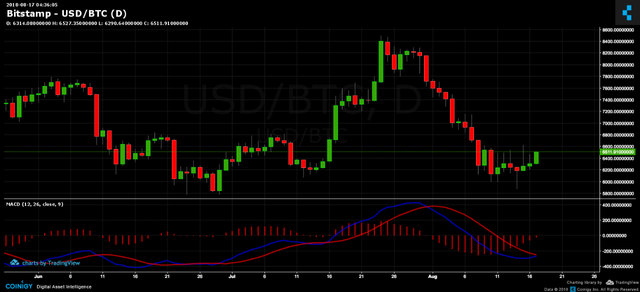
A trade can be initiated by examining the way in which these 3 lines intersect each other. Even though, some traders might use 2 exponential averages rather than 3, but relying on 3 exponential averages helps you in predicting the future price with greater precision.
5. Bollinger Bands
Bollinger Bands try to map out the price volatility of the asset class. They consist of 3 lines which are:
- Median line: The median line is the 20-day exponential moving average.
- Upper Curve: The upper curve is nothing but the median line to which twice the deviation is added.
- Lower Curve: The lower curve is nothing but the median line plus minus twice the standard deviation.
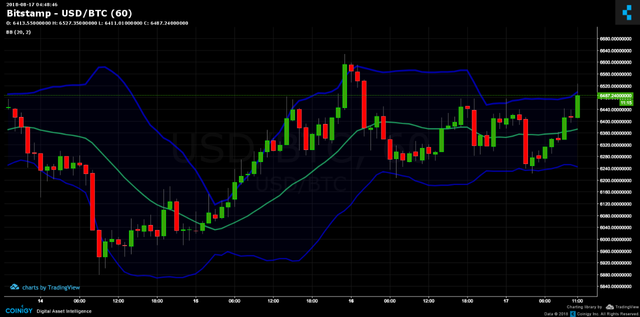
When you look at all the bands along with the price movement, they will for an envelope around the price movement. Whenever the price movement is stagnant over a longer period of time, these 3 lines converge. As a result, the width of the envelope decreases significantly.
At that point in time, a trade can be initiated only once the price movement breaks the envelope either on the upper side or on the lower side.
Additionally, the volume can be used as a confirmation indicator to confirm the breakout. It can help you in predicting large breakouts right at the start.
Thus, when you are looking to trade in cryptocurrencies, it is important to use technical analysis to initiate your trades. With the help of these 5 technical indicators, it will become much easier for you to make profits by trading in cryptocurrencies.
Would you upvote this post and follow us because this will encourage us to write more articles like this one?

Crypto data & analytics powered by Machine Learning and Artificial Intelligence.
Nvest.ai is helping crypto traders and investors make better decisions with next generation tools and leading them to the next level.
Visit our website: http://nvest.ai

well-explained. Thanks.
nvest is an amazing project.
Thank you very much @thecryptoninja for your kind comment and we are glad the post is useful for you.