Bitcoin Flashback - Why the $20,000 All Time High? How Early 2015 gave a hint.
Imagine buying in at $150/Bitcoin, while setting a target of $20,000 nearly three years before the absolute peak. Well the bad news is you most likely did not do this, but the good news is we have a solid tool/method that did plot the 20k high years before it hit.
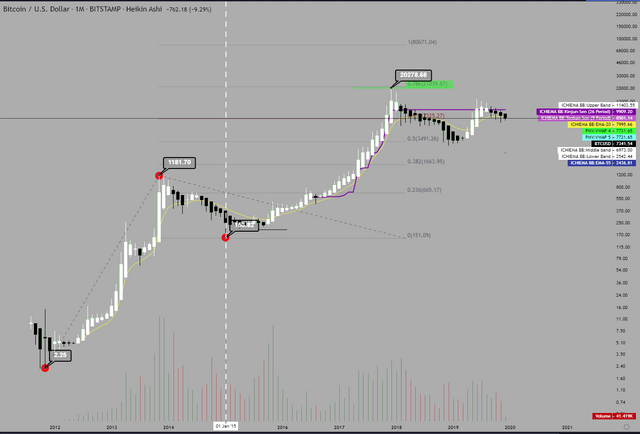
Using a Log scale with a Trend-Based Fibonacci Extension on the Monthly chart, plot the all time low at $2.25 in late 2011, second point the 1180 high in November 2013, and the Bear market low of $150 in January 2015. Well look at that - the 0.786 Fibonacci level falls right on $20,000 at the tip of the wick.
So there you have it, the next all time high projected three years before. But lets drag those levels to the right more and see what else lined up as time went on...
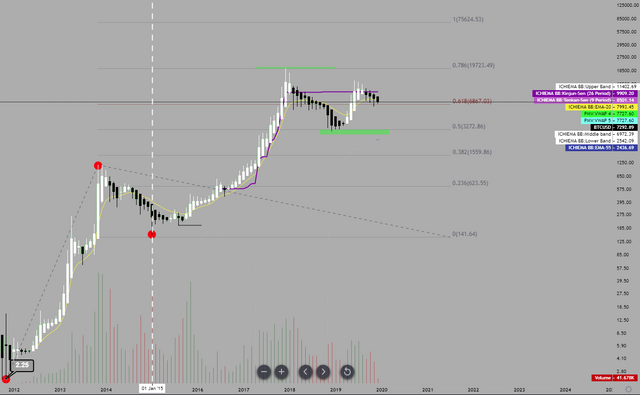
The bottom of the next bear market - 0.5 fib level at $3200. So lets assume that history repeats (or rhymes) and replicate this method to project a target 3-4 years from now to see what we might get.
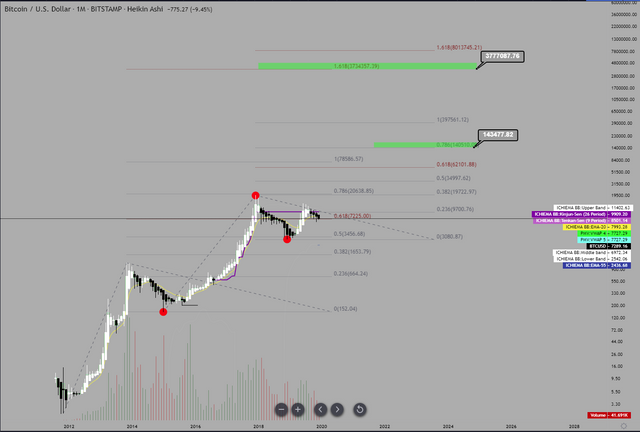
So we get the 0.786 level at $144,000. However if you are a Fibonacci or Elliot wave trader, you are probably looking at that initial 1.618 level from the 2012/2013/2015 waves - this target is at $374,000 if we consider a wider context of 2018/19 a corrective leg.
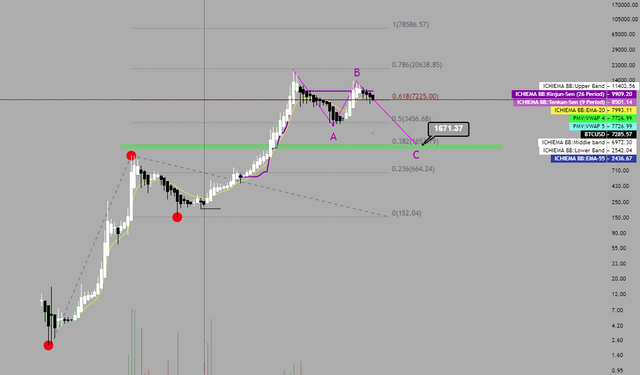
Now what i will do here is something new, I call it 'reverse-confluence' - a kind of back-engineering Fibonacci points to match confluence levels. Instead of taking the $3,200 low point, I'm going to move it lower until more of the previous fib levels match up - this can give us a possible 'lower-low'. With this lower low, I then use a retrace and see if it again has confluence with both the former extension and retrace levels. So lets have a look at that.
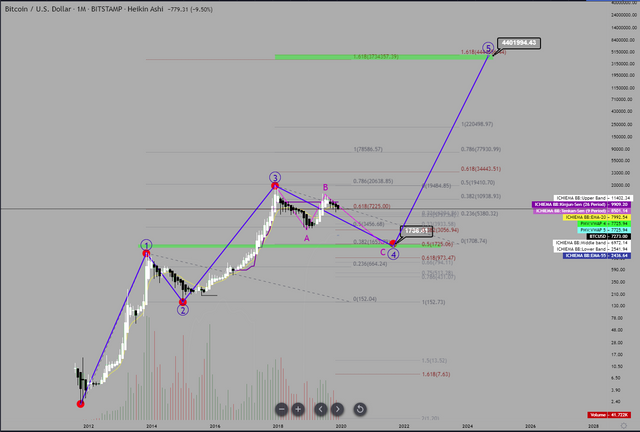
$1740 - at this price level we have the 0.5 log retrace of $150/$20,000, the 0.38 log extension of $2.50/$1145/$150, plus our new extension levels show greater confluence at the 1.618 ($380,000/$440,000) and the 0.5 level matching the current all time high at $20,000. For added measure, all of this still fits within an Eliot wave pattern, particularly the ABC correction that still respects those original fib levels method at the start of this analysis.
However this is just speculation, and there is a little something that may prevent this extremely low (but reasonable) target - Hidden bullish divergence, it's boarder line considered and exaggerated divergence but a bullish cue none-the-less. See below - Blue line is divergence line, Red line is major trendline.
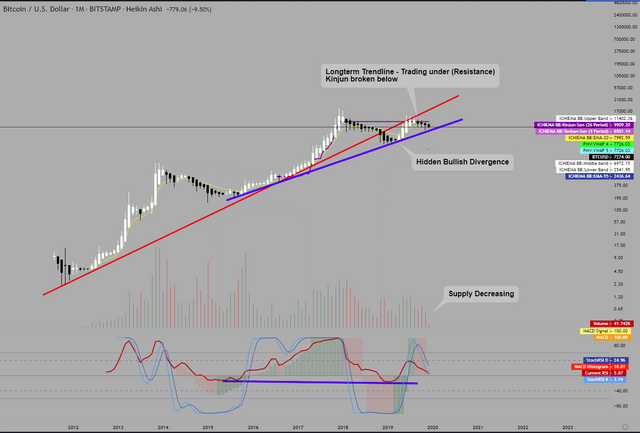
Supply is decreasing so we should see a swing move soon either down or up - to be honest it is a crucial point for Bitcoin to either make or break what has been no doubt the two most significant trend lines in it's history. Personally I am still bias for a longer bear market - back to 32xx, or maybe even 17xx for yet another sad year for alts in 2020. We shall see how things unfold as we approach the halving in May.
Anywho, I hope you enjoyed the read and my thoughts/speculation - just remember i am not a licensed professional and manage your own risk :)
Have a Merry Christmas and Happy New Year folks.
Congratulations @mickbit! You have completed the following achievement on the Steem blockchain and have been rewarded with new badge(s) :
You can view your badges on your Steem Board and compare to others on the Steem Ranking
If you no longer want to receive notifications, reply to this comment with the word
STOPTo support your work, I also upvoted your post!
Vote for @Steemitboard as a witness to get one more award and increased upvotes!